Section 02 · Applied Data Science IDCamp Expert · Education Analytics · ML Classification

Student Dropout
Prediction

Jaya Jaya Institut had a 32% dropout rate — 1 in 3 students never finishing their degree. I built a machine learning system using XGBoost to identify at-risk students early, achieving 92.42% accuracy and AUC 97.27%, with a Looker Studio dashboard and Streamlit app for actionable intervention.

Model XGBoost · Random Forest Stack scikit-learn · SMOTE · Streamlit · Looker Studio Dataset 4,424 students · 37 features · 2008–2015 Level IDCamp Expert
92.42%
Model accuracy
on test set
97.27%
ROC-AUC score
near-perfect
32.12%
Institutional
dropout rate
4,424
Student records
2008–2015
01 — Problem

1 in 3 students drops out. The institution has no early warning.

Jaya Jaya Institut has operated since 2000 with over 1,000 enrolled students. By 2015, 32.12% of their students — 1,421 out of 4,424 — had dropped out before graduating. No system existed to flag at-risk students early enough for intervention.

Late intervention is expensive and ineffective. A student who reaches their 4th semester with consistent academic struggles has already established patterns that are hard to break. The business problem: build a system that identifies dropout risk in the first two semesters, while there's still time to act.

The dataset contains 37 features across three domains:

  • Academic signals — Curricular units enrolled, approved, and evaluated per semester (1st and 2nd). Grade averages. These are the strongest predictors.
  • Financial signals — Tuition fee payment status, debtor status, scholarship holder status. A student behind on fees is at dramatically elevated risk.
  • Demographic context — Age at enrollment, gender, marital status, program (course), nationality. These provide context for interpretation.
XGBoost SMOTE Classification Education Analytics Looker Studio Streamlit
02 — Solution Architecture

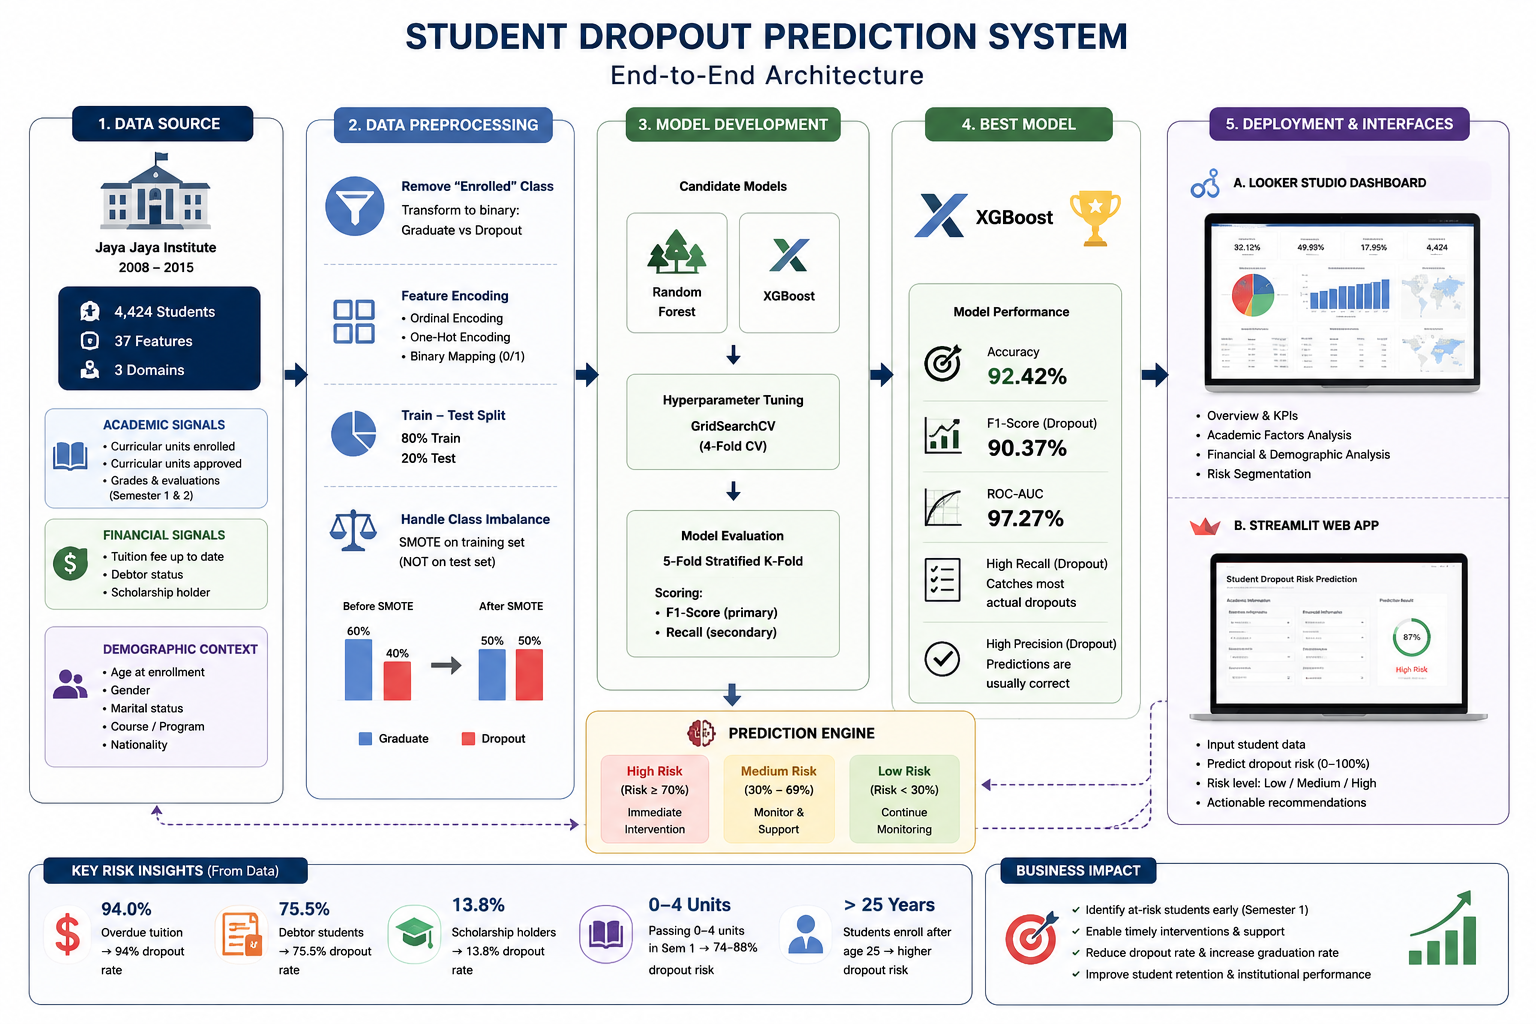
End-to-end pipeline: business problem to production interface

Project architecture: Business Problem → EDA → Model → Dashboard → Streamlit App
Business problem → EDA (academic · financial · demographic) → XGBoost model → Looker Studio dashboard (administrators) + Streamlit prediction app (counsellors).

Key technical decisions: SMOTE applied to training split only (never test set); XGBoost selected via GridSearchCV over Random Forest; primary metric is F1 + Recall on the dropout class — a model predicting "graduate" for everyone scores 68% accuracy but catches zero at-risk students.

Model
XGBoost
Imbalance
SMOTE
Tuning
GridSearchCV
Eval
5-fold StratifiedKFold
Dashboard
Looker Studio
App
Streamlit
03 — Model Results

92.42% accuracy, AUC 97.27% — what do these numbers mean operationally?

Metric Result Interpretation
Accuracy 92.42% Of all predictions, 92.42% are correct
F1-Score (Dropout class) 90.37% Balanced precision/recall on the class that matters
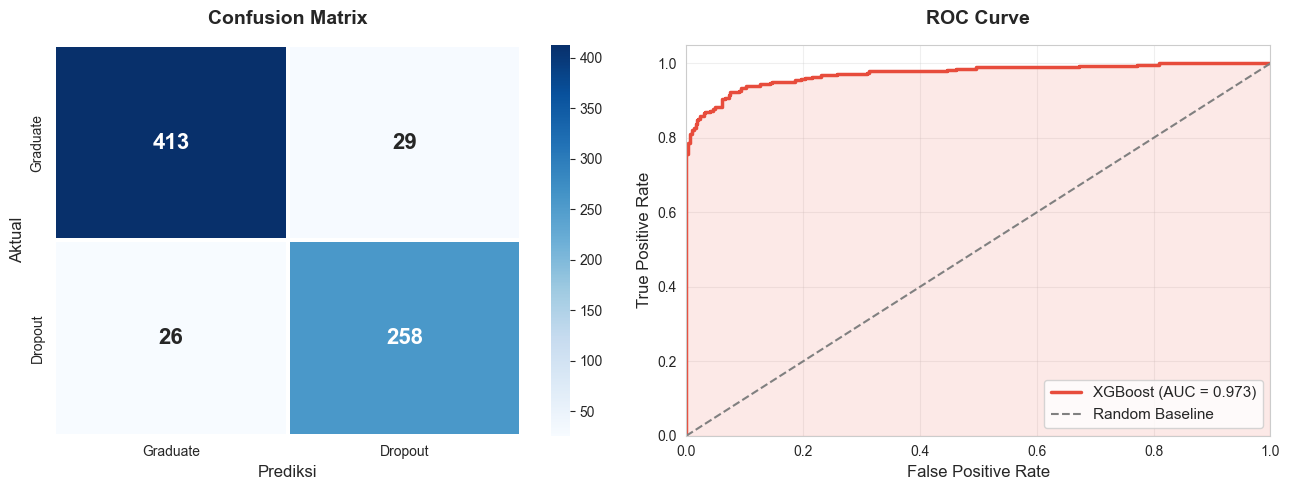
ROC-AUC 97.27% Excellent discrimination between dropout and graduate
Precision (Dropout) High When model flags dropout, it's usually right
Recall (Dropout) High Model catches most actual dropouts
Confusion matrix — XGBoost on test set showing high true positive and true negative counts with low false positive rate
Confusion matrix · XGBoost on test set · low false-positive rate — when the model flags dropout, it is usually right

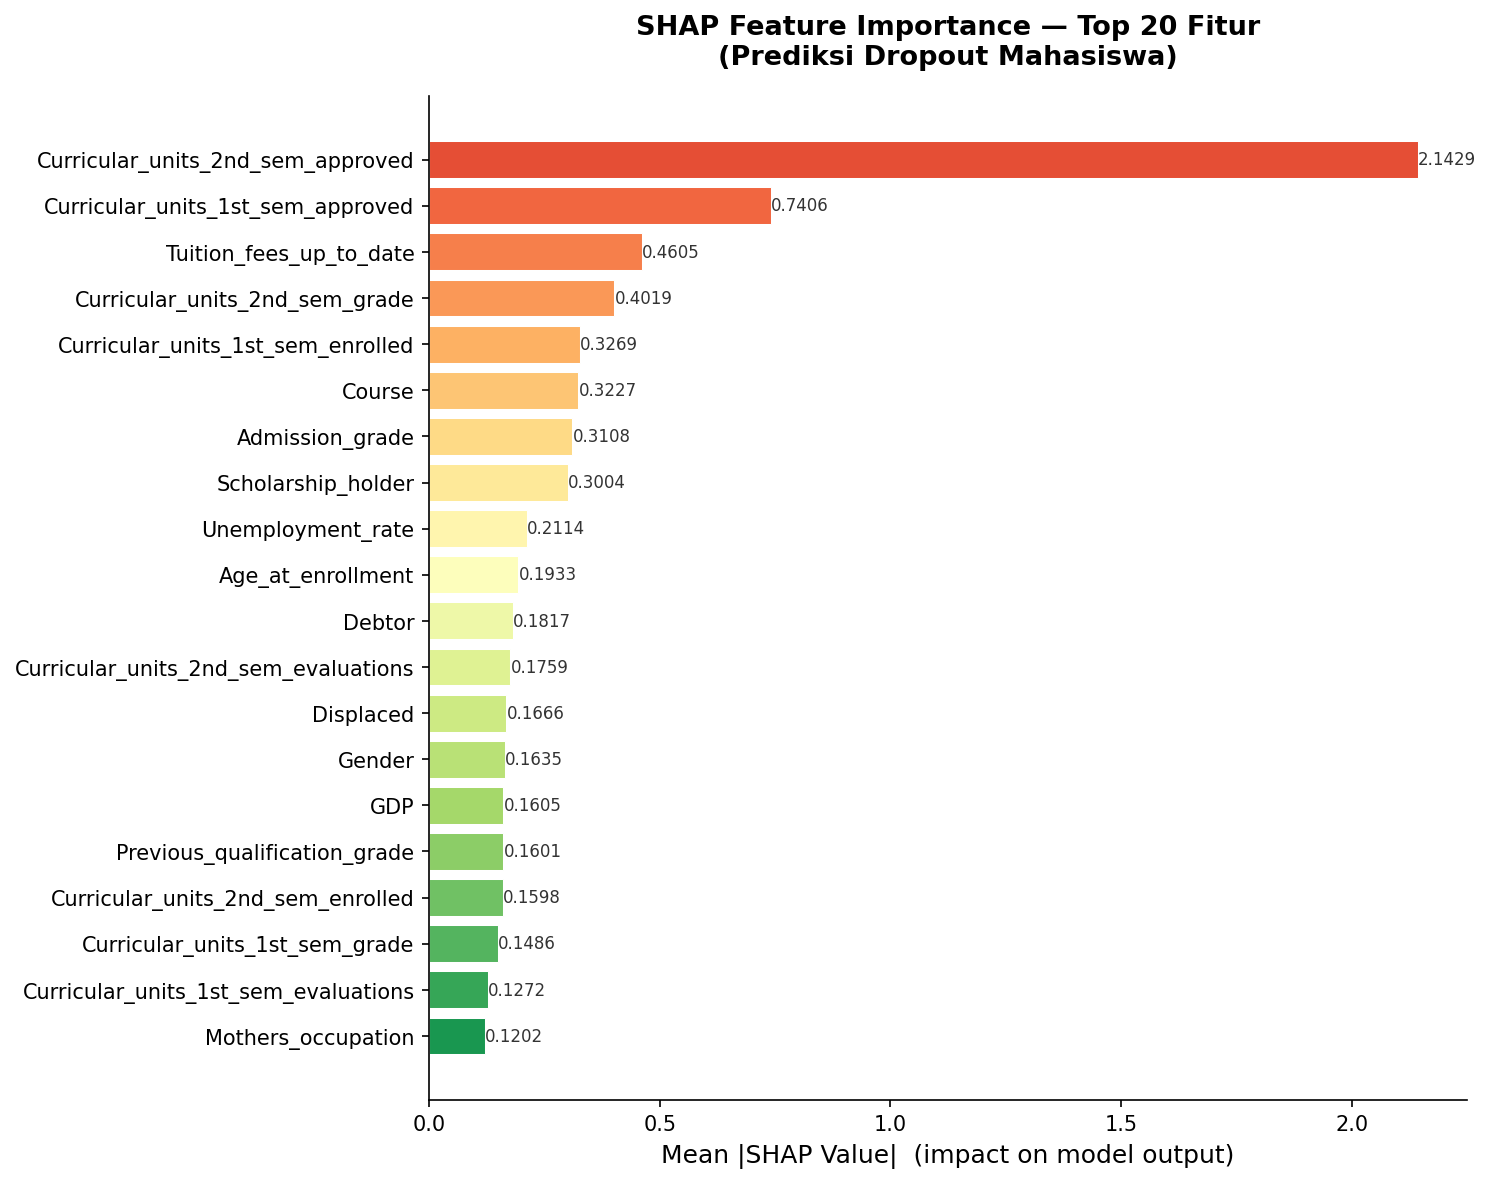
Top 3 Feature Importance (SHAP)

Curricular Units 2nd Sem (Approved)SHAP 2.14
Curricular Units 1st Sem (Approved)SHAP 0.74
Tuition Fees Up To DateSHAP 0.46
SHAP feature importance chart — top 20 features, curricular_units_2nd_sem_approved dominates at 2.14, followed by 1st sem approved at 0.74 and tuition fees at 0.46
SHAP feature importance (mean |SHAP value|) · top 20 features · academic signals in semesters 1 and 2 are the two strongest predictors

The top two predictors are both academic: courses approved in semester 2 (SHAP 2.14) and semester 1 (SHAP 0.74). Tuition payment status ranks third (SHAP 0.46). A student failing courses in both semesters who is also behind on fees has compounding risk — the model captures all three dimensions simultaneously.

04 — Key Risk Insights

What the data reveals about who drops out and why

Financial risk
94%
Students with overdue tuition fees show a 94.0% dropout rate — the single most predictive individual factor.
Debtor status
75.5%
Students with outstanding debt to the institution show 75.5% dropout rate. Financial stress and academic failure co-occur.
Scholarship effect
13.8%
Scholarship holders show only 13.8% dropout rate vs 48.4% for non-holders. Financial support dramatically changes outcomes.
Academic threshold
0–4
Passing 0–4 units in semester 1 predicts 74–88% dropout. This is the clearest early-warning threshold for counselor intervention.
Graduation rate
49.93%
Less than half of enrolled students graduate. Combined with 32.12% dropout, the institution has room for significant improvement.
Age factor
>25
Students who enroll after age 25 show elevated dropout rates — likely due to competing work and family obligations.
"A student behind on tuition AND passing fewer than 4 courses in semester 1 has a dropout probability that the model flags above 90%. These students need intervention in week 8 of semester 1 — not after year 2."
05 — Deliverables

From model to two production interfaces

Looker Studio Dashboard (4 Pages)

Interactive business dashboard built for academic leadership and counselors:

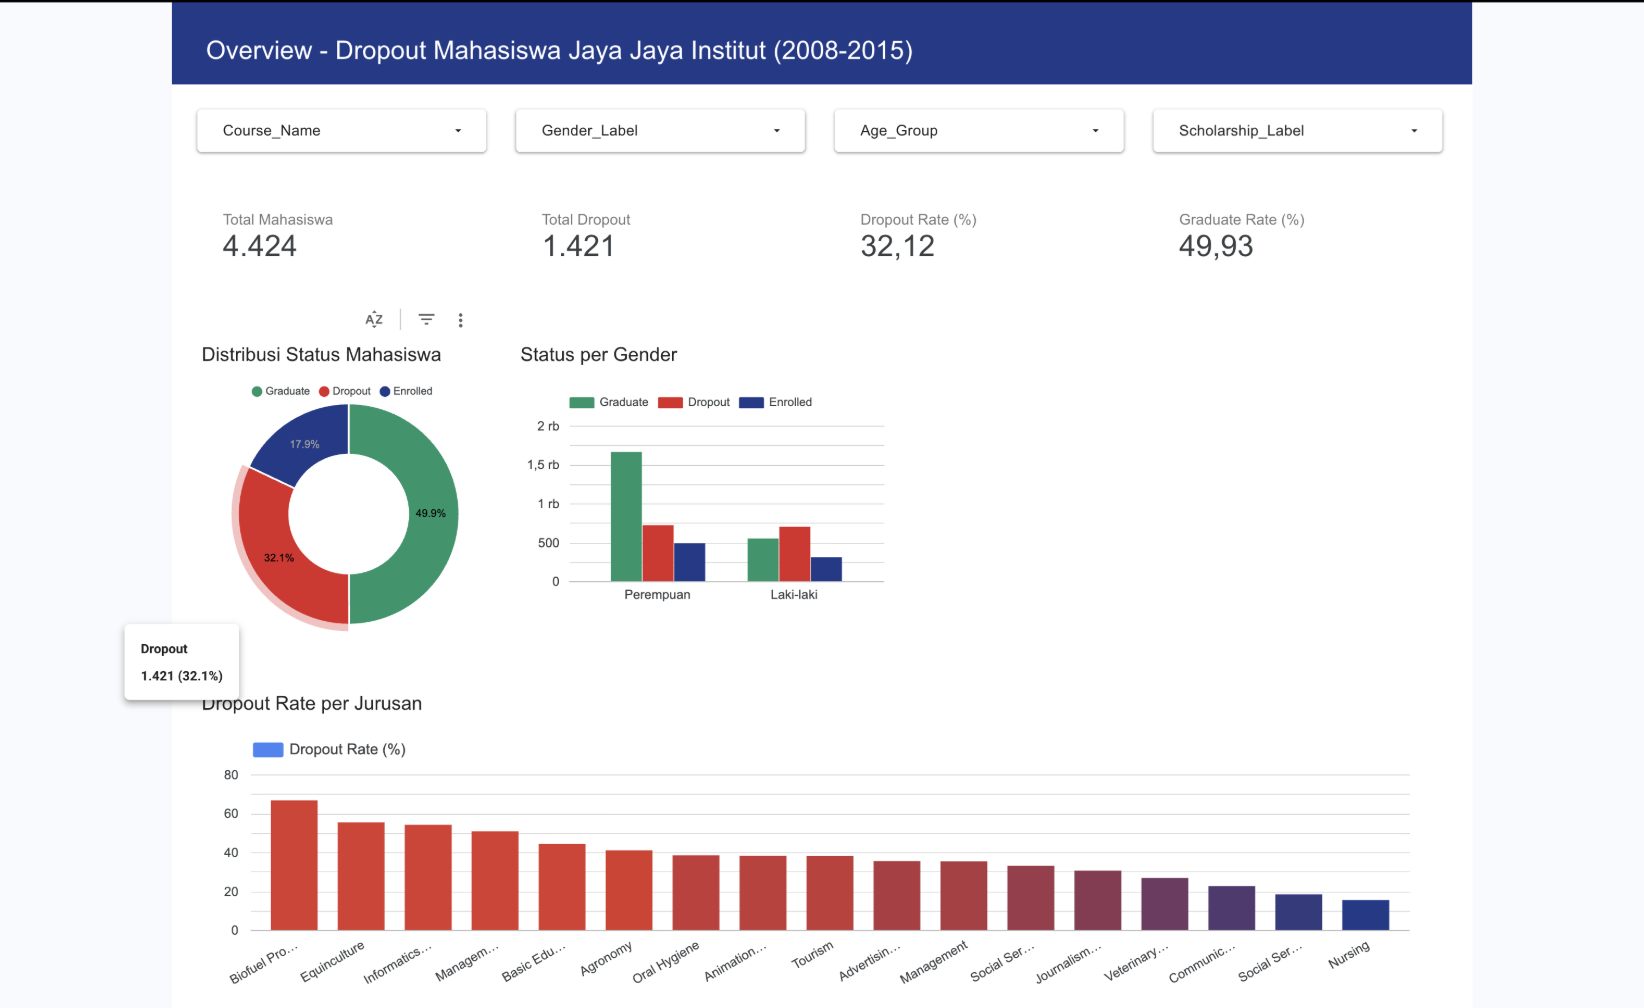
  • Overview page — 4 KPIs (dropout rate 32.12%, graduation rate 49.93%), department and gender filter controls
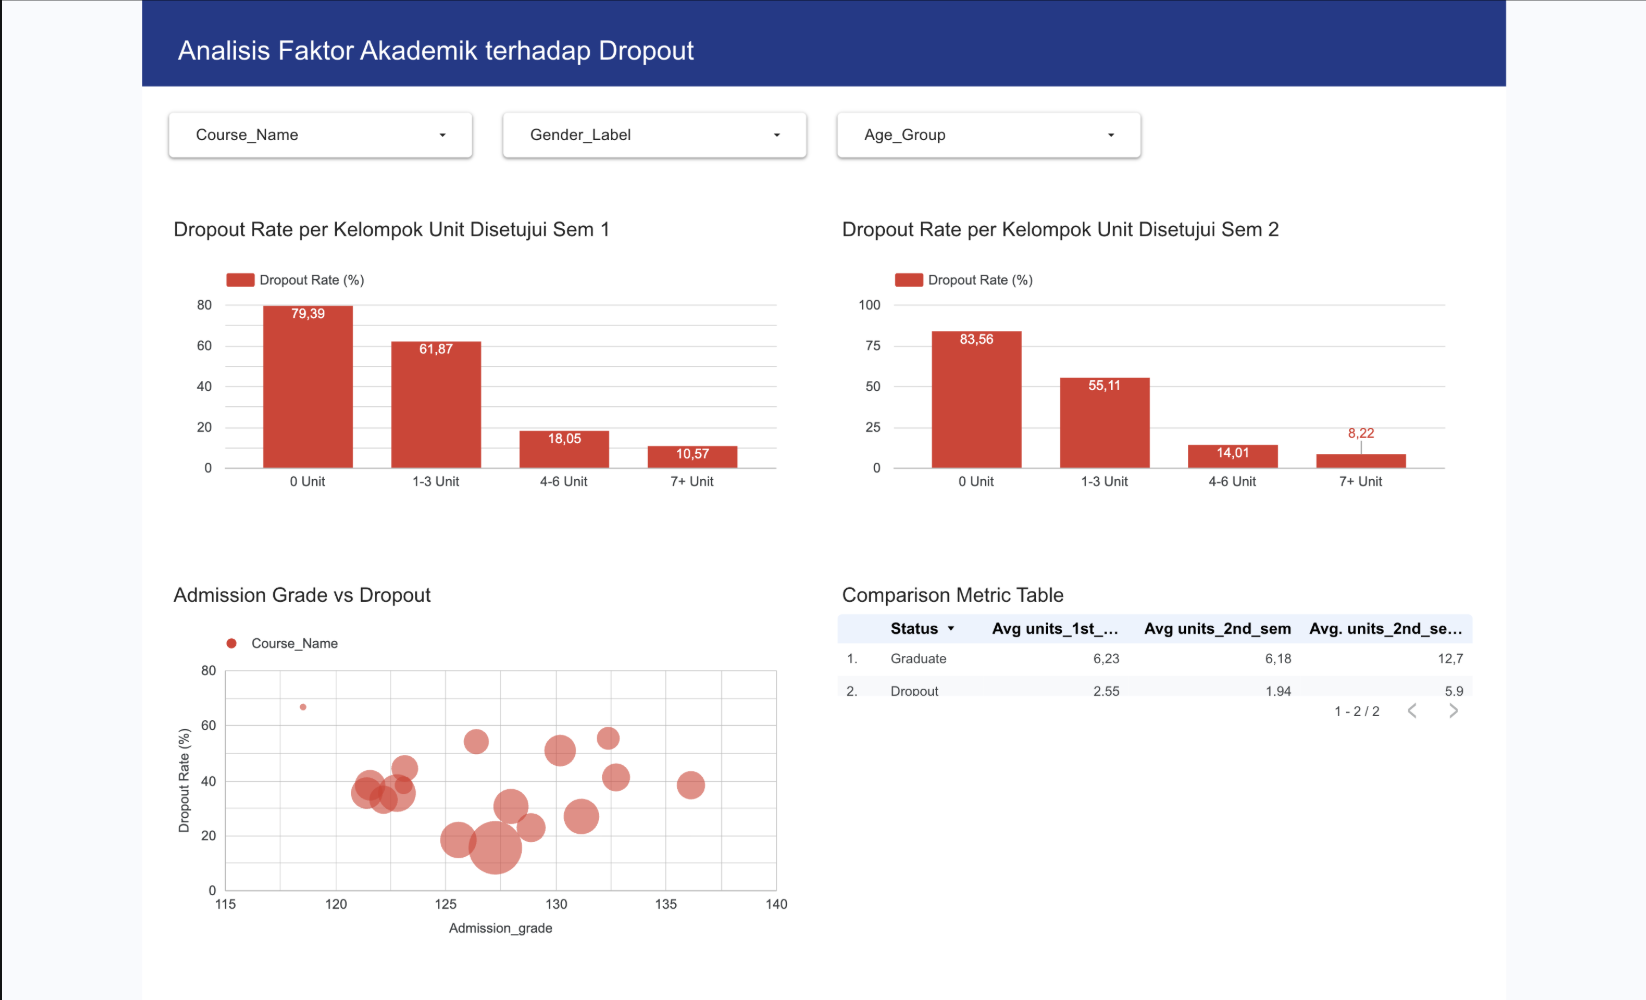
  • Academic factors — Semester 1 and 2 performance breakdown, grade distributions, approved units vs dropout correlation
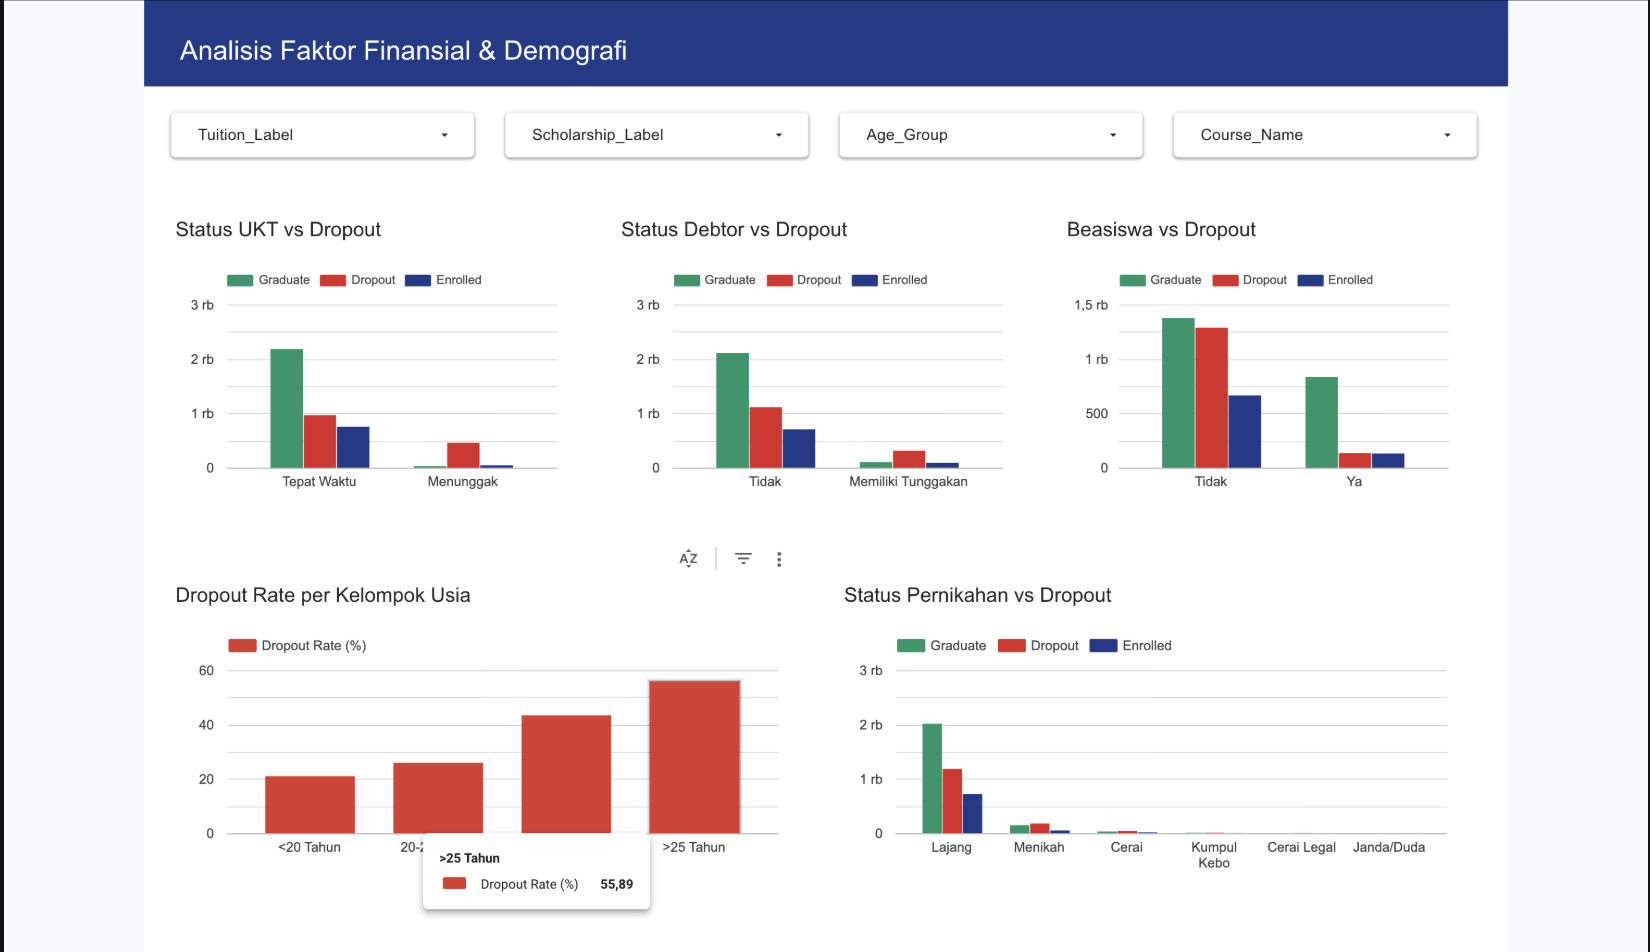
  • Financial & demographics — Tuition payment status, scholarship impact, age distribution, marital status breakdown
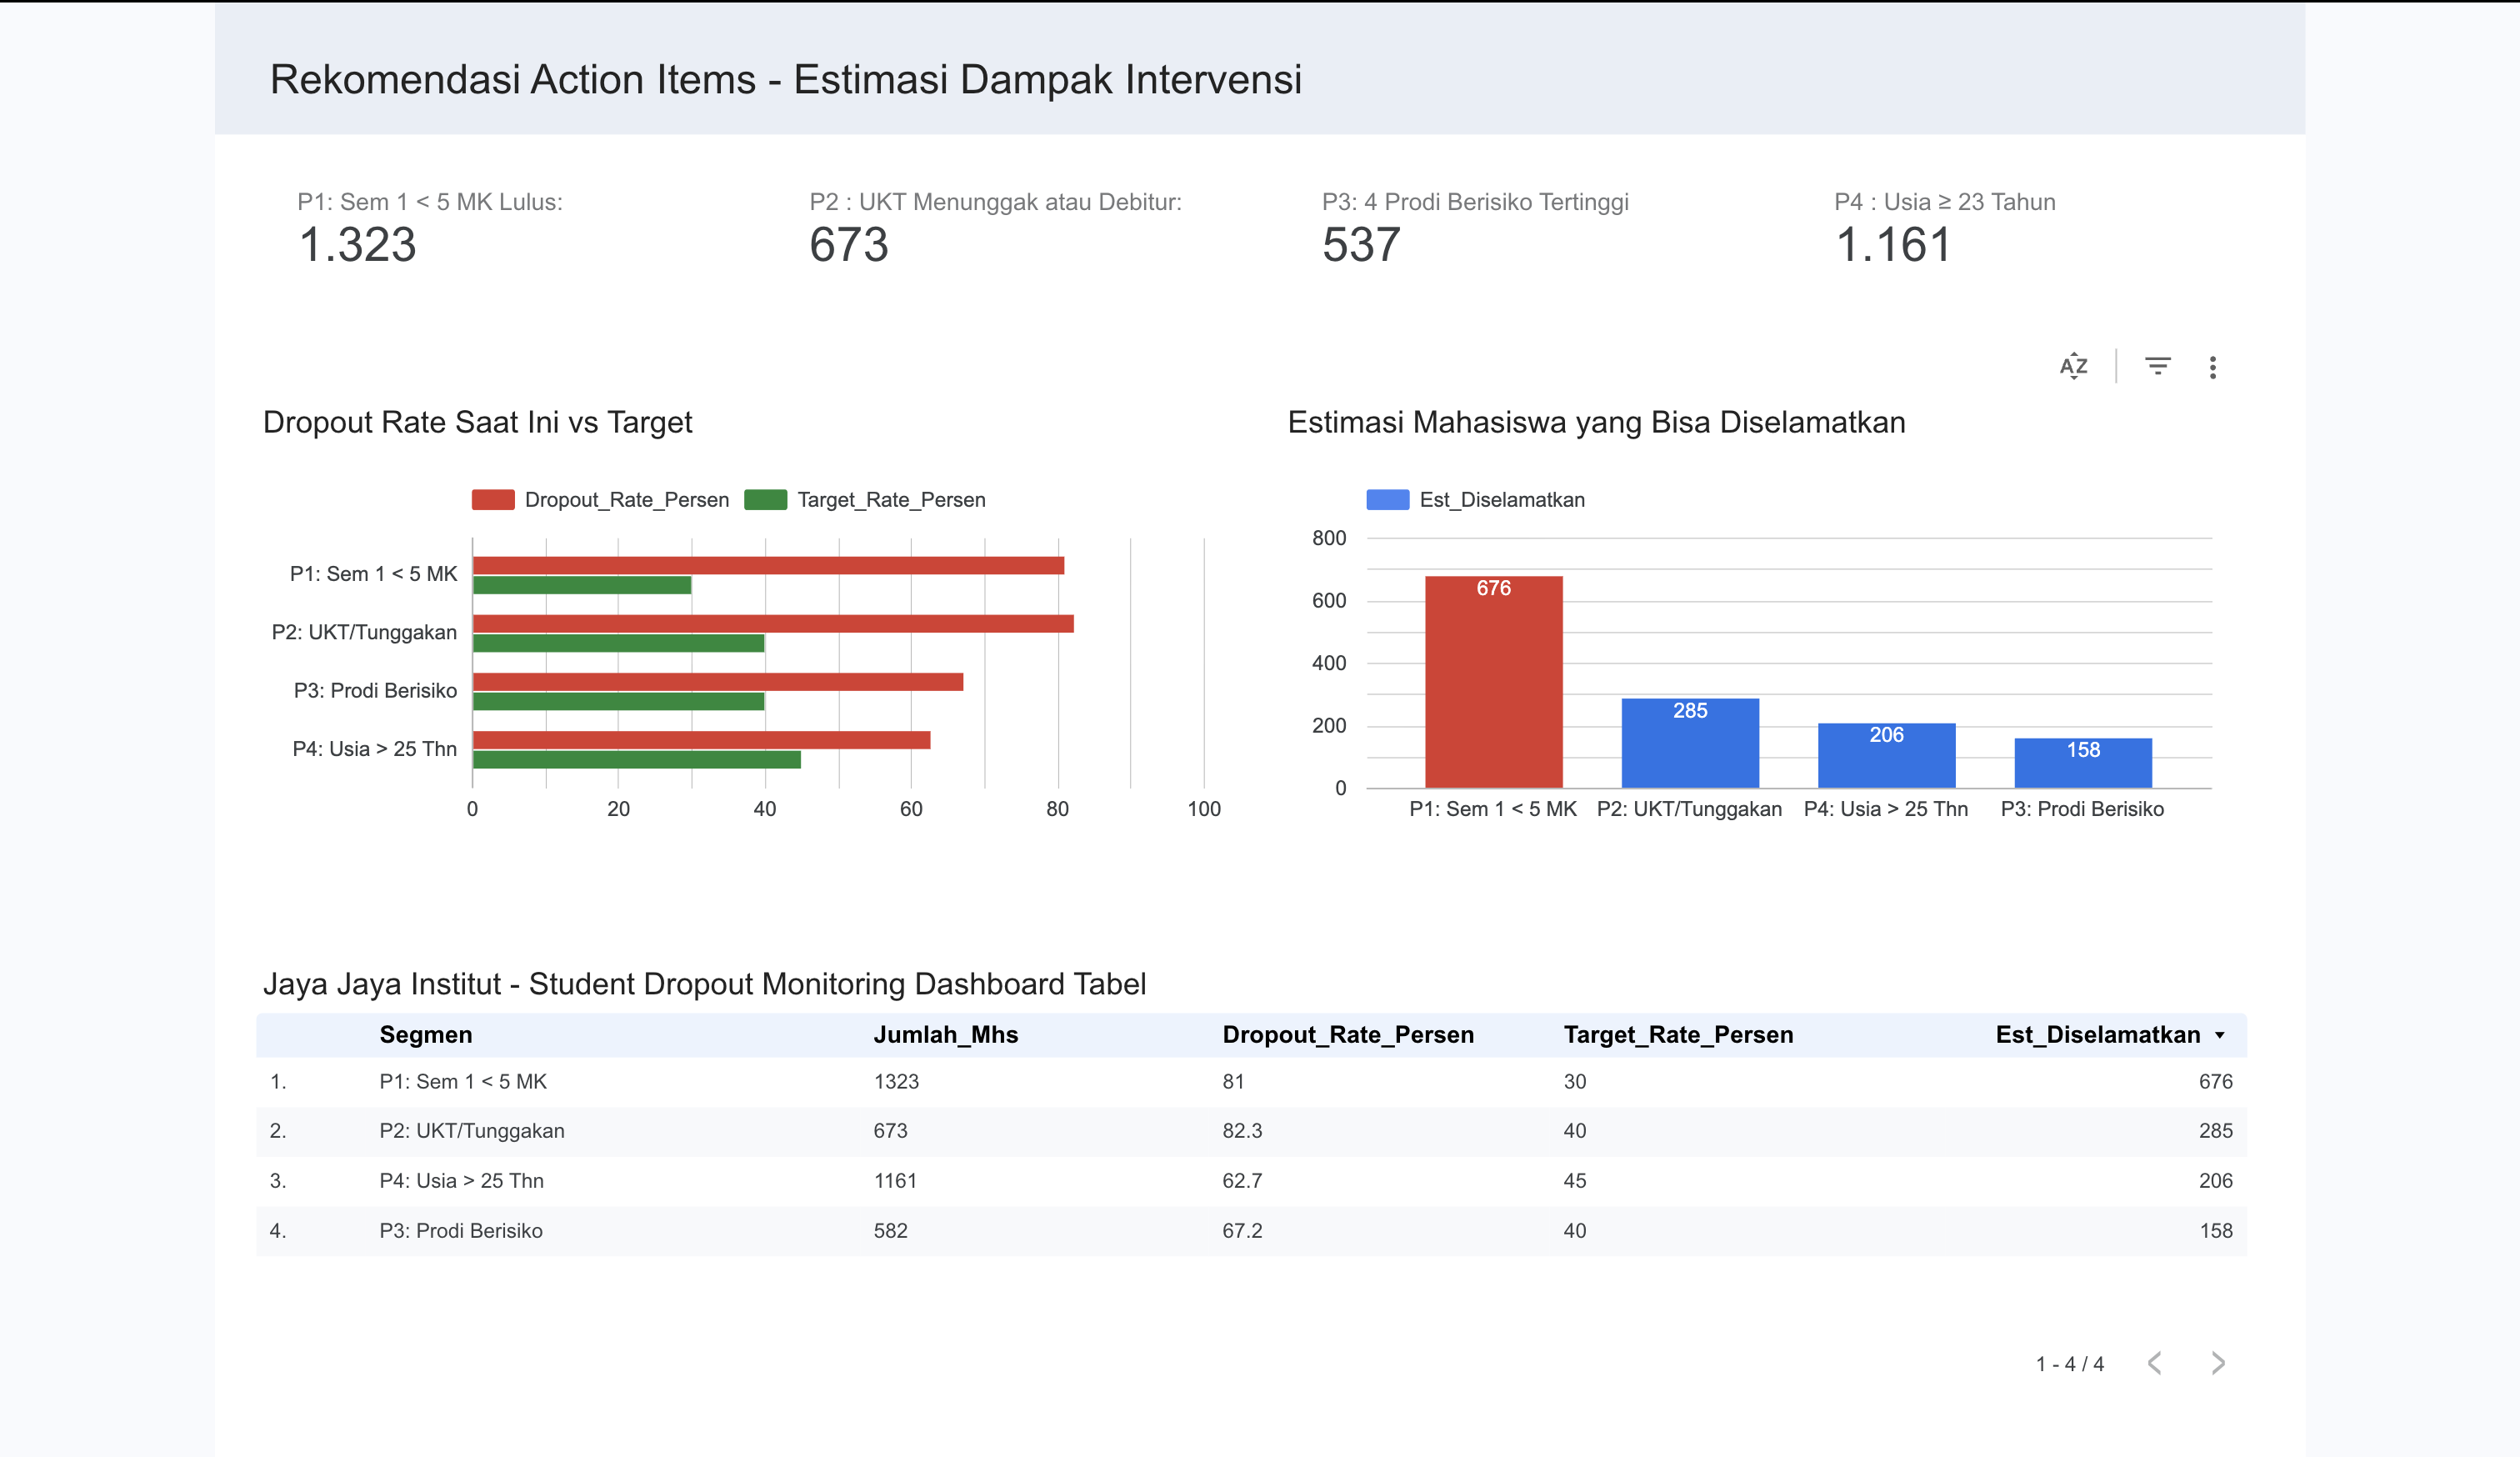
  • Intervention page — Action recommendations with before/after impact simulation showing how targeted support could shift outcomes

Streamlit Prediction App (2 Tabs)

Deployed prediction interface for counselors to assess individual students:

  • Model explanation tab — Algorithm comparison (RF vs XGBoost), feature importance chart, methodology notes for non-technical users
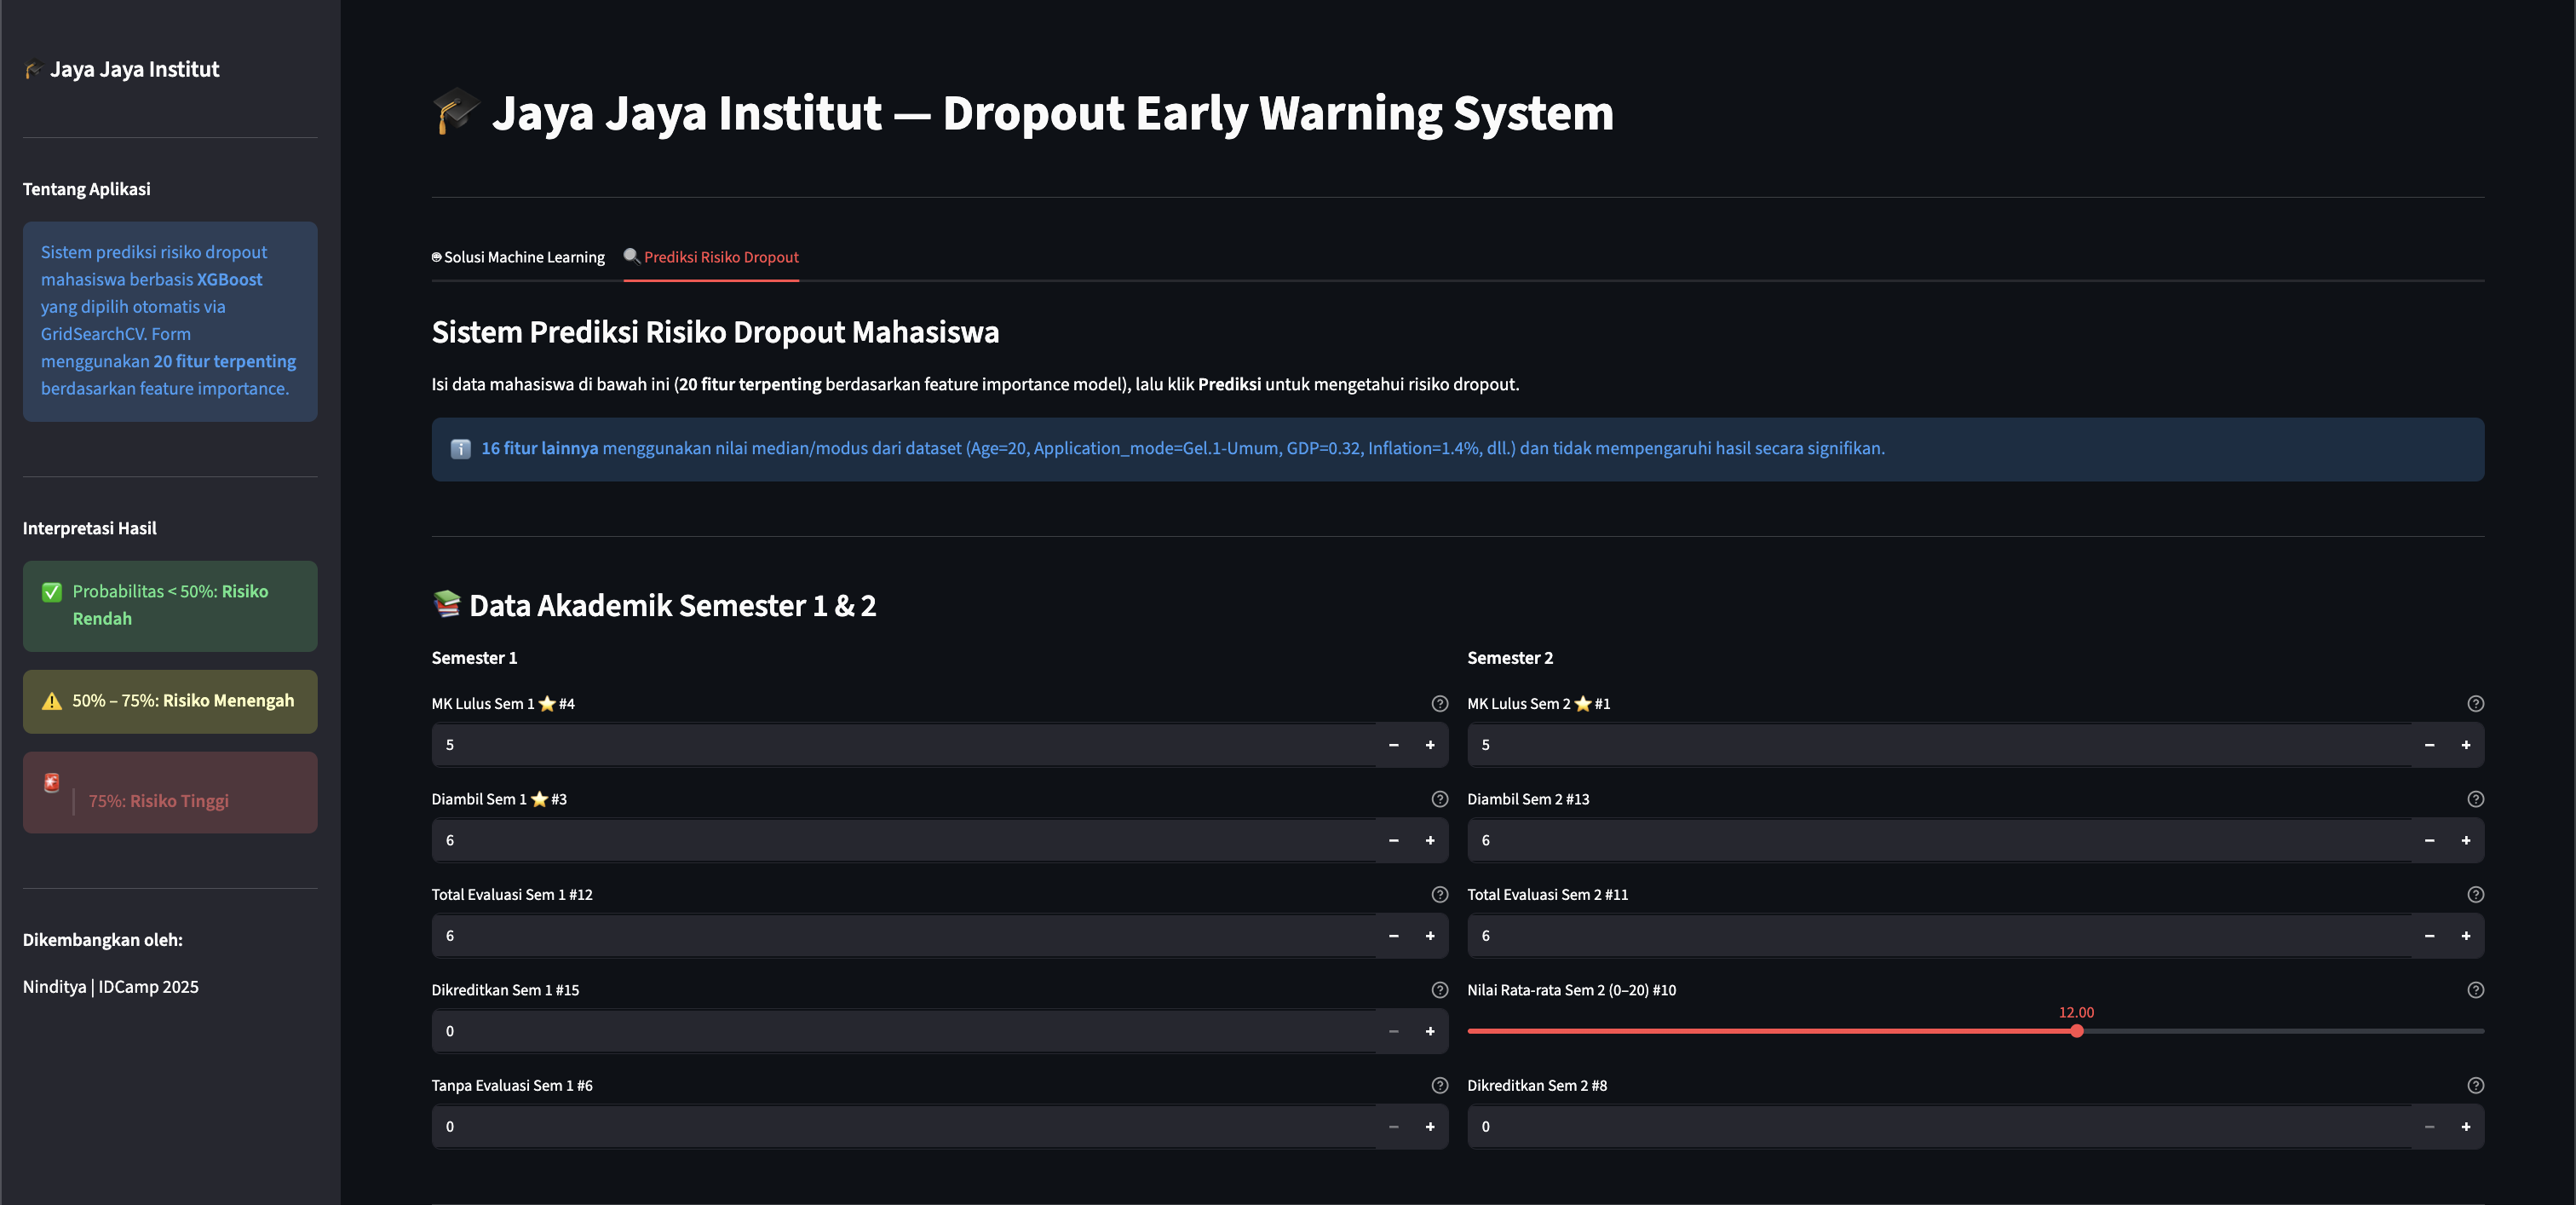
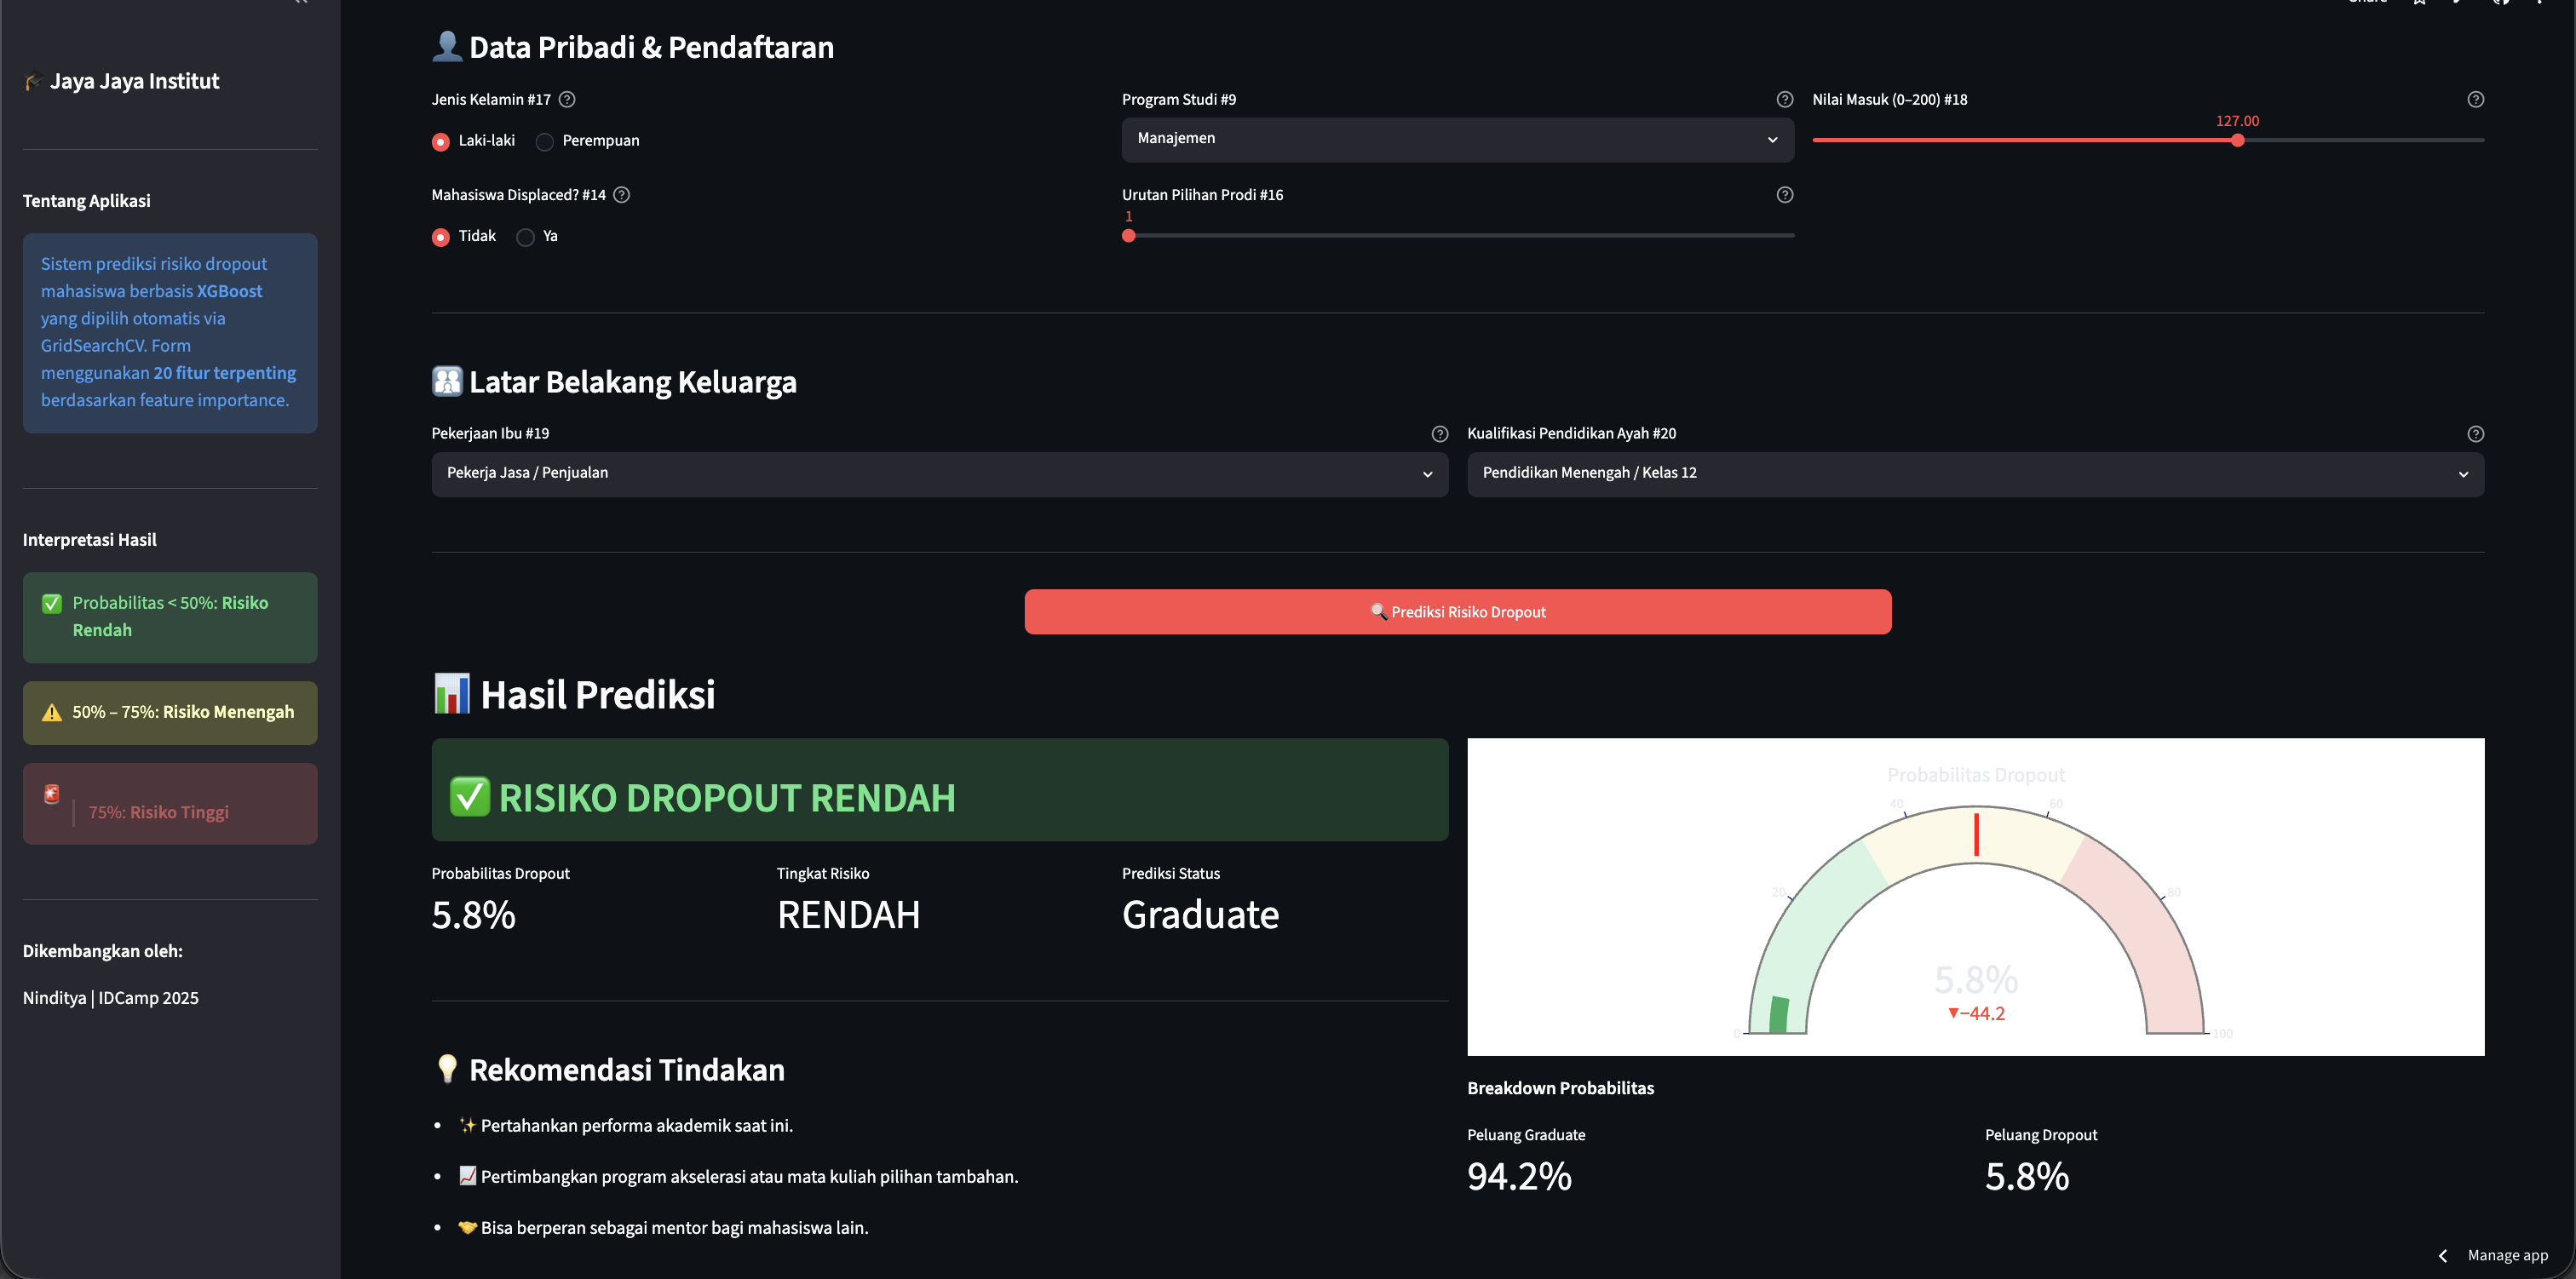
  • Prediction form tab — 20-feature input form (academic + financial + demographic), real-time risk gauge showing dropout probability percentage, and actionable intervention recommendations based on the specific risk factors flagged
06 — Business Impact

From model to measurable institutional change

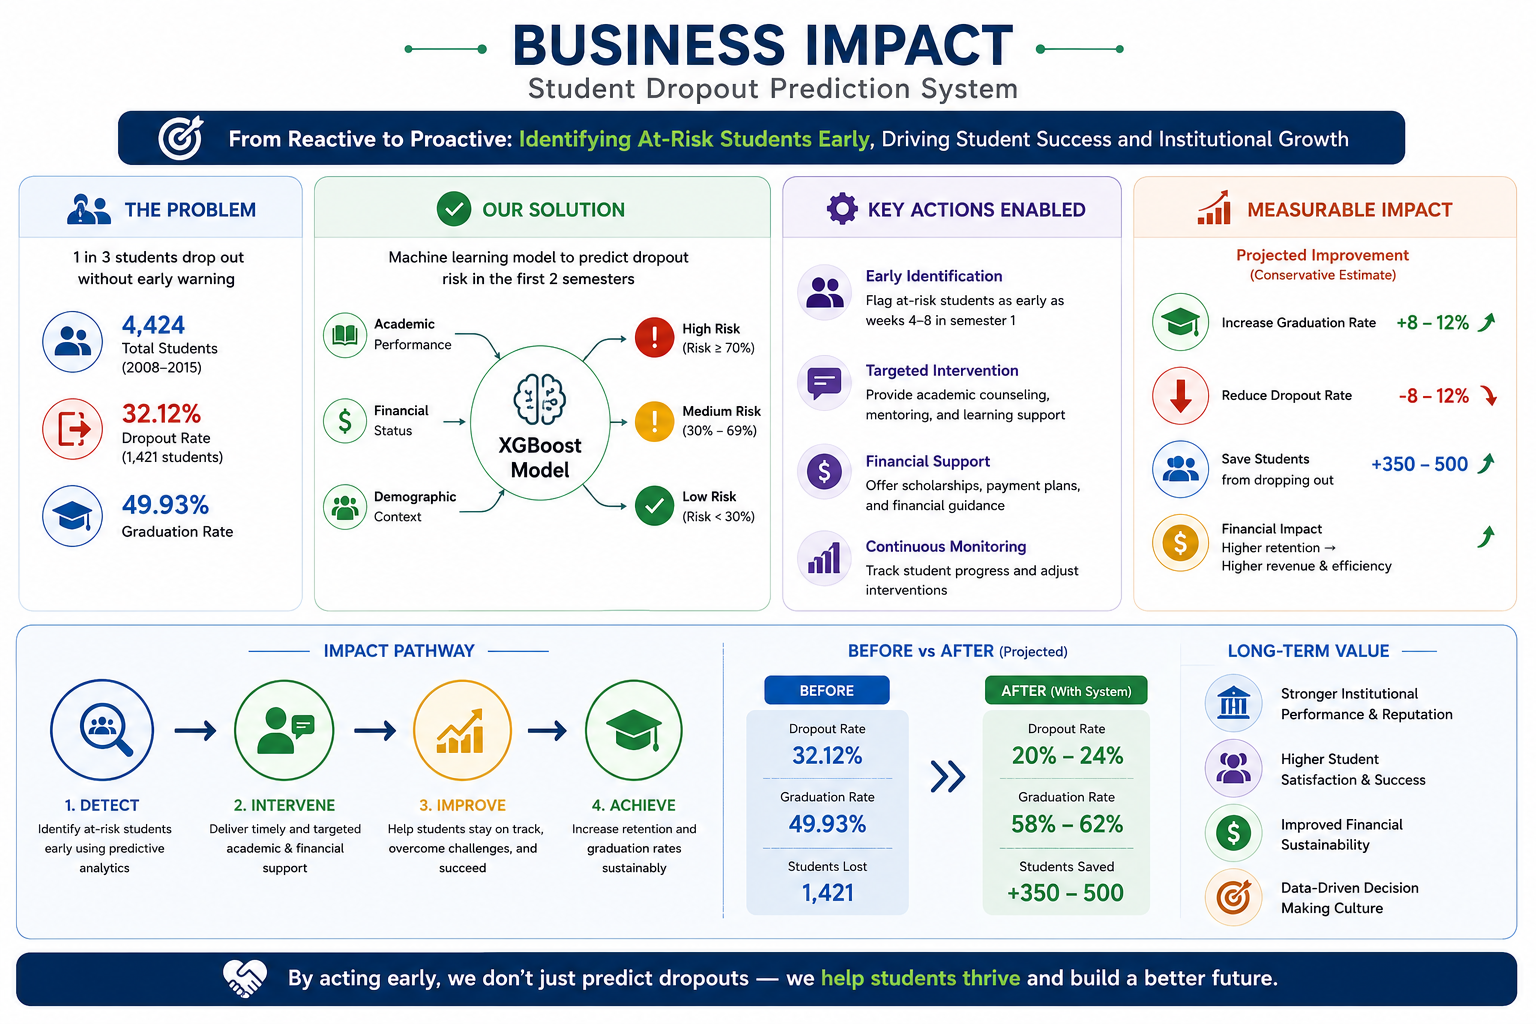
Business impact: ~1,325 students potentially saved with four targeted interventions
~1,325 of 1,421 at-risk students reachable with four targeted action items. Dashboard Page 4 shows before/after dropout rate estimates per intervention segment.
Identify early
Sem 1–2
Model flags at-risk students by end of semester 1 — while intervention is still possible.
Targeted action
4 types
Academic tutoring · financial aid referral · scholarship expansion · course load advisory — each mapped to a specific risk segment.
Potential reach
~1,325
Of 1,421 dropout students, ~1,325 are reachable with the four targeted interventions before they leave.
07 — Dashboard Preview

4-page Looker Studio dashboard — from overview to intervention

Interactive Looker Studio dashboard for academic leadership and counselors, covering institutional dropout patterns, academic and financial risk factors, and prioritized intervention targets.

Looker Studio Overview — 4,424 students, 1,421 dropouts (32.12% rate), dropout distribution by major and gender with filter controls
Overview · 4,424 students · 32.12% dropout rate · distribution by program and gender
Academic Factors — dropout rate by approved units in semester 1 and 2, admission grade vs dropout scatter plot, comparison metric table
Analisis Akademik · Units approved vs dropout rate · admission grade correlation
Financial and Demographic factors — UKT payment status, debt, scholarship impact, dropout rate by age group and marital status
Finansial & Demografi · UKT status · scholarship effect · age group breakdown
Action Items — 4 priority intervention segments (P1–P4), current dropout rate vs target rate, estimated students that can be saved per intervention
Rekomendasi & Intervensi · 4 priority segments · estimated students saved per action
08 — Streamlit App Preview

Counselor prediction interface — form input to risk output

Two-screen Streamlit app: a 20-field form collecting academic, financial, and demographic signals — and an output screen showing dropout probability with actionable intervention recommendations.

Streamlit prediction form — 20 input fields for academic units, tuition status, and demographics
Form input · 20 fields · academic + financial + demographic signals
Streamlit prediction result — dropout probability score and targeted intervention recommendations
Hasil prediksi · dropout probability · rekomendasi intervensi spesifik

The form is designed for school counselors — not data scientists. Input fields group logically: semester 1 academic performance, semester 2 performance, financial status, then demographics. The output screen shows a single risk percentage and targeted intervention recommendations keyed to the student's specific flagged risk factors. No ML jargon in the UI.

Learning Context

Expert level, final submission. Passed — with honest notes.

This project was the final submission for Belajar Penerapan Data Science, the IDCamp 2025 Expert level. It came after the Employee Attrition project (first submission), where I had already absorbed lessons about reproducibility, specific recommendations, and the cost of missed details. This was the second chance to apply all of that.

Beginner (4 courses) Intermediate (Air Quality Dashboard) Belajar Matematika untuk Data Science Expert Submission 1 (Employee Attrition) → Expert Submission 2 (this project)

Reviewer feedback — passed, with honest notes.

Two areas of feedback: what worked well and what could be improved:

Future Development

Based on reviewer feedback, here's what the next iteration of this tool will include:

Mass Upload (Batch Prediction)

Replace the one-student-at-a-time form with a CSV/Excel upload interface for batch predictions. A counselor managing 300 students can't manually enter each one — batch upload is what makes the tool usable at institutional scale.

Student Identifier Column

Add a Student ID field to the prediction output so counselors can map results back to their enrollment system. Without an identifier, the prediction data is hard to act on in practice.

User Manual Tab

Add a dedicated how-to-use tab in the Streamlit app explaining the input fields, how to interpret the risk score, and what actions to take for high-risk students. Makes the tool accessible to non-technical counselors.

Bias & Fairness Check

Run a fairness analysis: does the model predict dropout differently based on socioeconomic status, age, or gender? A model that achieves 92% accuracy overall can still be systematically wrong for specific subgroups — this check is non-optional for any ML system applied to human outcomes.
Try it · See the code

Dropout prediction app + full source on GitHub.

Try the Streamlit counselor interface or explore the XGBoost pipeline, Looker Studio dashboard, and full source on GitHub.