02 · Solution Architecture
From raw HR data to operational HR intelligence.
The pipeline goes end-to-end: data cleaning, feature engineering, SMOTE class balancing, XGBoost training, batch prediction, PostgreSQL storage, and Metabase visualisation — all containerised with Docker.
Data
📄
IBM HR Dataset
1,470 employees · 72 features
🧹
Data Cleaning
drop constants, encode binary
⚙️
Feature Engineering
HRFeatureEngineer pipeline
↓
Model Training
⚖️
SMOTE
train data only · balance classes
🔍
GridSearchCV
4-fold · tune XGBoost
🌲
XGBoost
86.11% recall · AUC 81.93%
↓
Infrastructure
💾
PostgreSQL
Docker container
📊
Metabase
5-tab HR dashboard
👥
HR Team
browser-based access
Key engineering decisions
- SMOTE on train only — Synthetic minority samples are created before train/test split to prevent data leakage into evaluation metrics
- Custom sklearn transformer —
HRFeatureEngineer bundles age-grouping, binary encoding, ordinal encoding, and one-hot encoding into a single reusable pipeline step
- Stratified K-Fold — 5-fold evaluation preserves class ratio across folds; GridSearchCV uses 4-fold for hyperparameter tuning
- Docker Compose — single
docker compose up starts both PostgreSQL and Metabase containers; no manual database setup
- SQLAlchemy batch write — prediction results written directly to PostgreSQL, automatically populating the Metabase Early Warning tab
03 · Model Selection
Recall beats accuracy when missing a leaver costs more than a false alarm.
Baseline
Logistic Regression
✗ Misses too many leavers
Selected
XGBoost
✓ Best business choice
Why False Negatives Are Expensive
XGBoost has lower raw accuracy because it aggressively catches attritors, flagging some who stay. But in HR, a false positive costs a counselling conversation. A false negative costs an employee. The asymmetry clearly favors recall.
04 · Key Risk Factors
Overtime, first-year tenure, young age. Three compounding multipliers.
🥇 Top Risk Factor
Tenure ≤ 1 year
34.59%
Attrition rate
~4× vs 5+ year peers
🥈 Risk Factor
Age 18–25
38.04%
Attrition rate
~4× vs 46+ cohort
🥉 Risk Factor
Sales Representative
43.10%
Attrition rate
Highest attrition role
4 Risk Factor
Overtime Required
31.92%
Attrition rate
~3× vs no overtime
5 Risk Factor
Low Salary (Q1)
29.06%
Attrition rate
~3× vs top quartile
6 Risk Factor
Poor Work-Life Balance
32.14%
Attrition rate
~3× vs score 4
Feature Importance
"The first year is the most vulnerable — 34.59% of employees with ≤1 year tenure leave. Pair that with overtime or low salary, and you've identified employees who almost certainly won't see year 2."
07 · Dashboard Showcase
5-tab Metabase dashboard — from executive KPIs to individual risk scores.
Built on Docker + PostgreSQL. HR teams access everything through the browser — no Jupyter notebooks, no Python scripts.
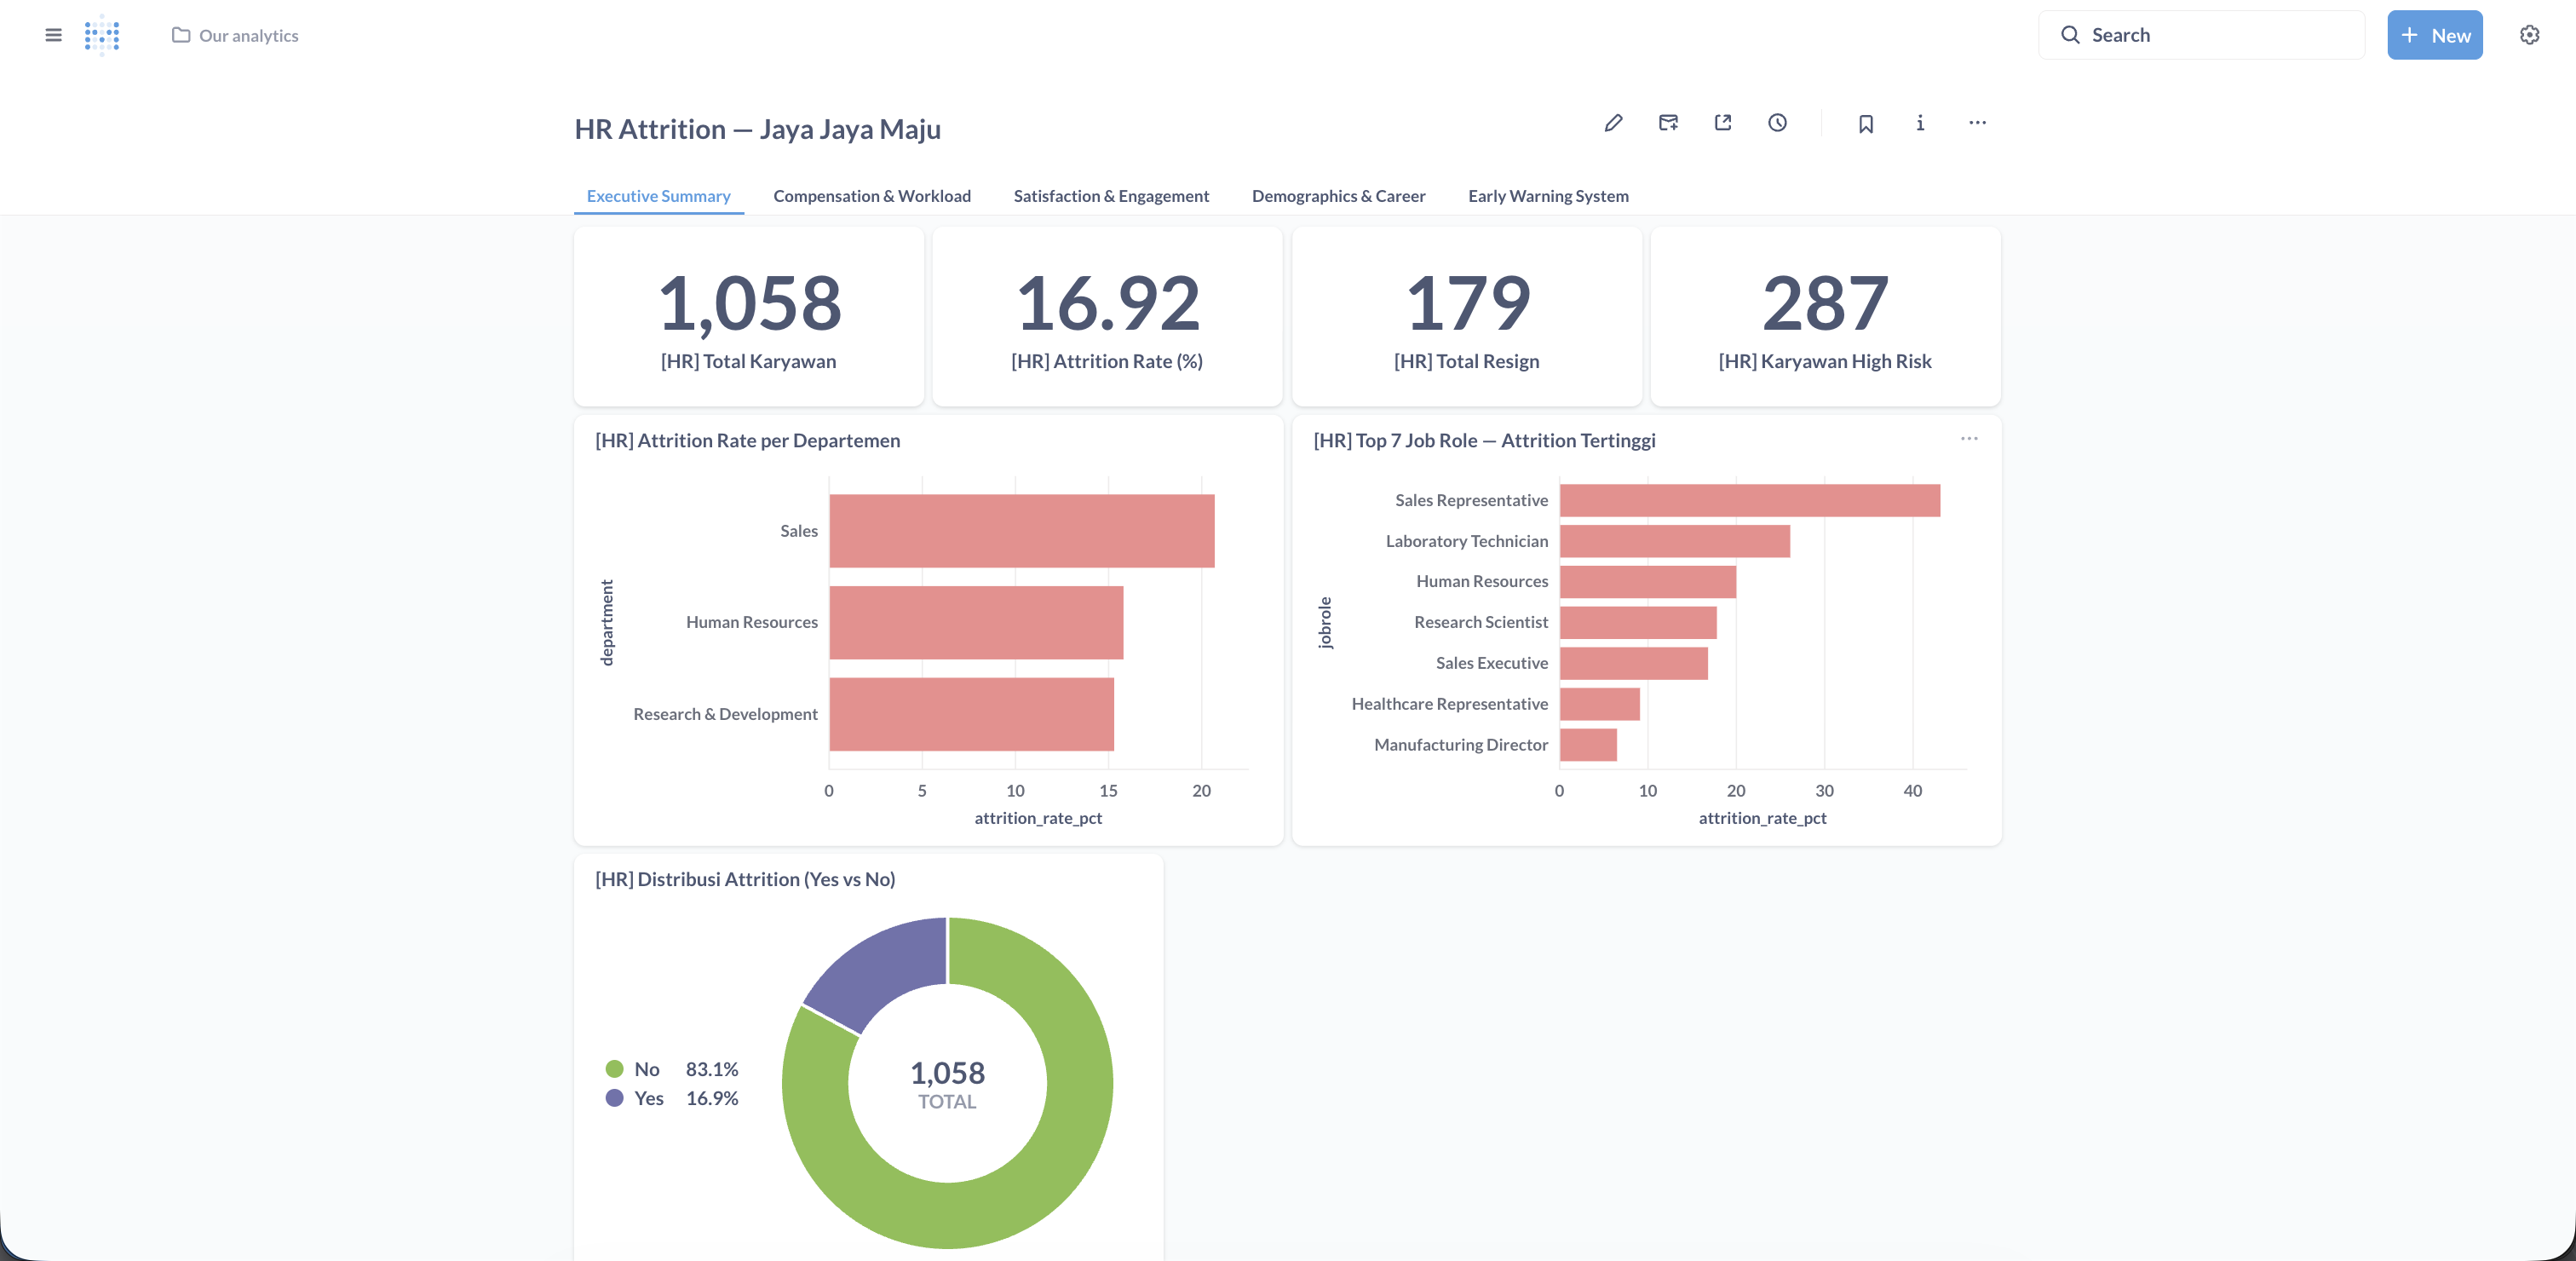
① Executive Summary KPIs · Attrition rate · Department & role breakdown
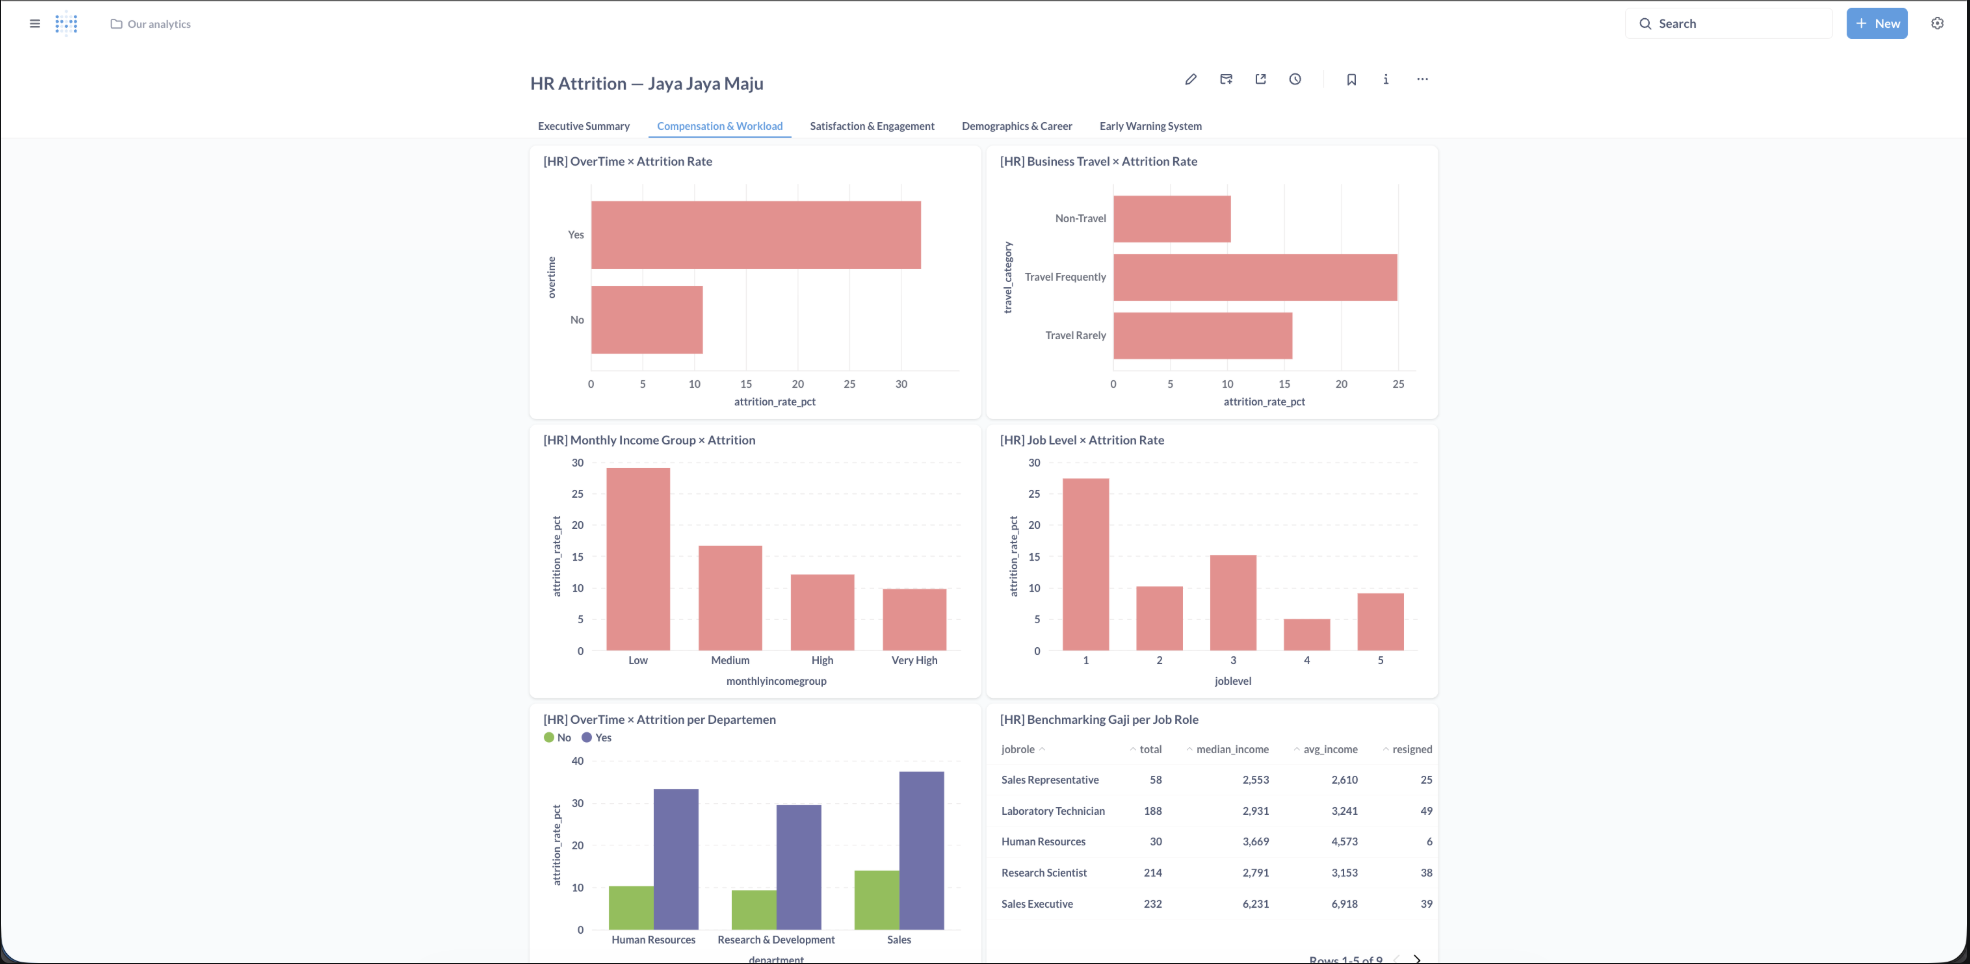
② Compensation & Workload Overtime · salary quartiles · travel impact
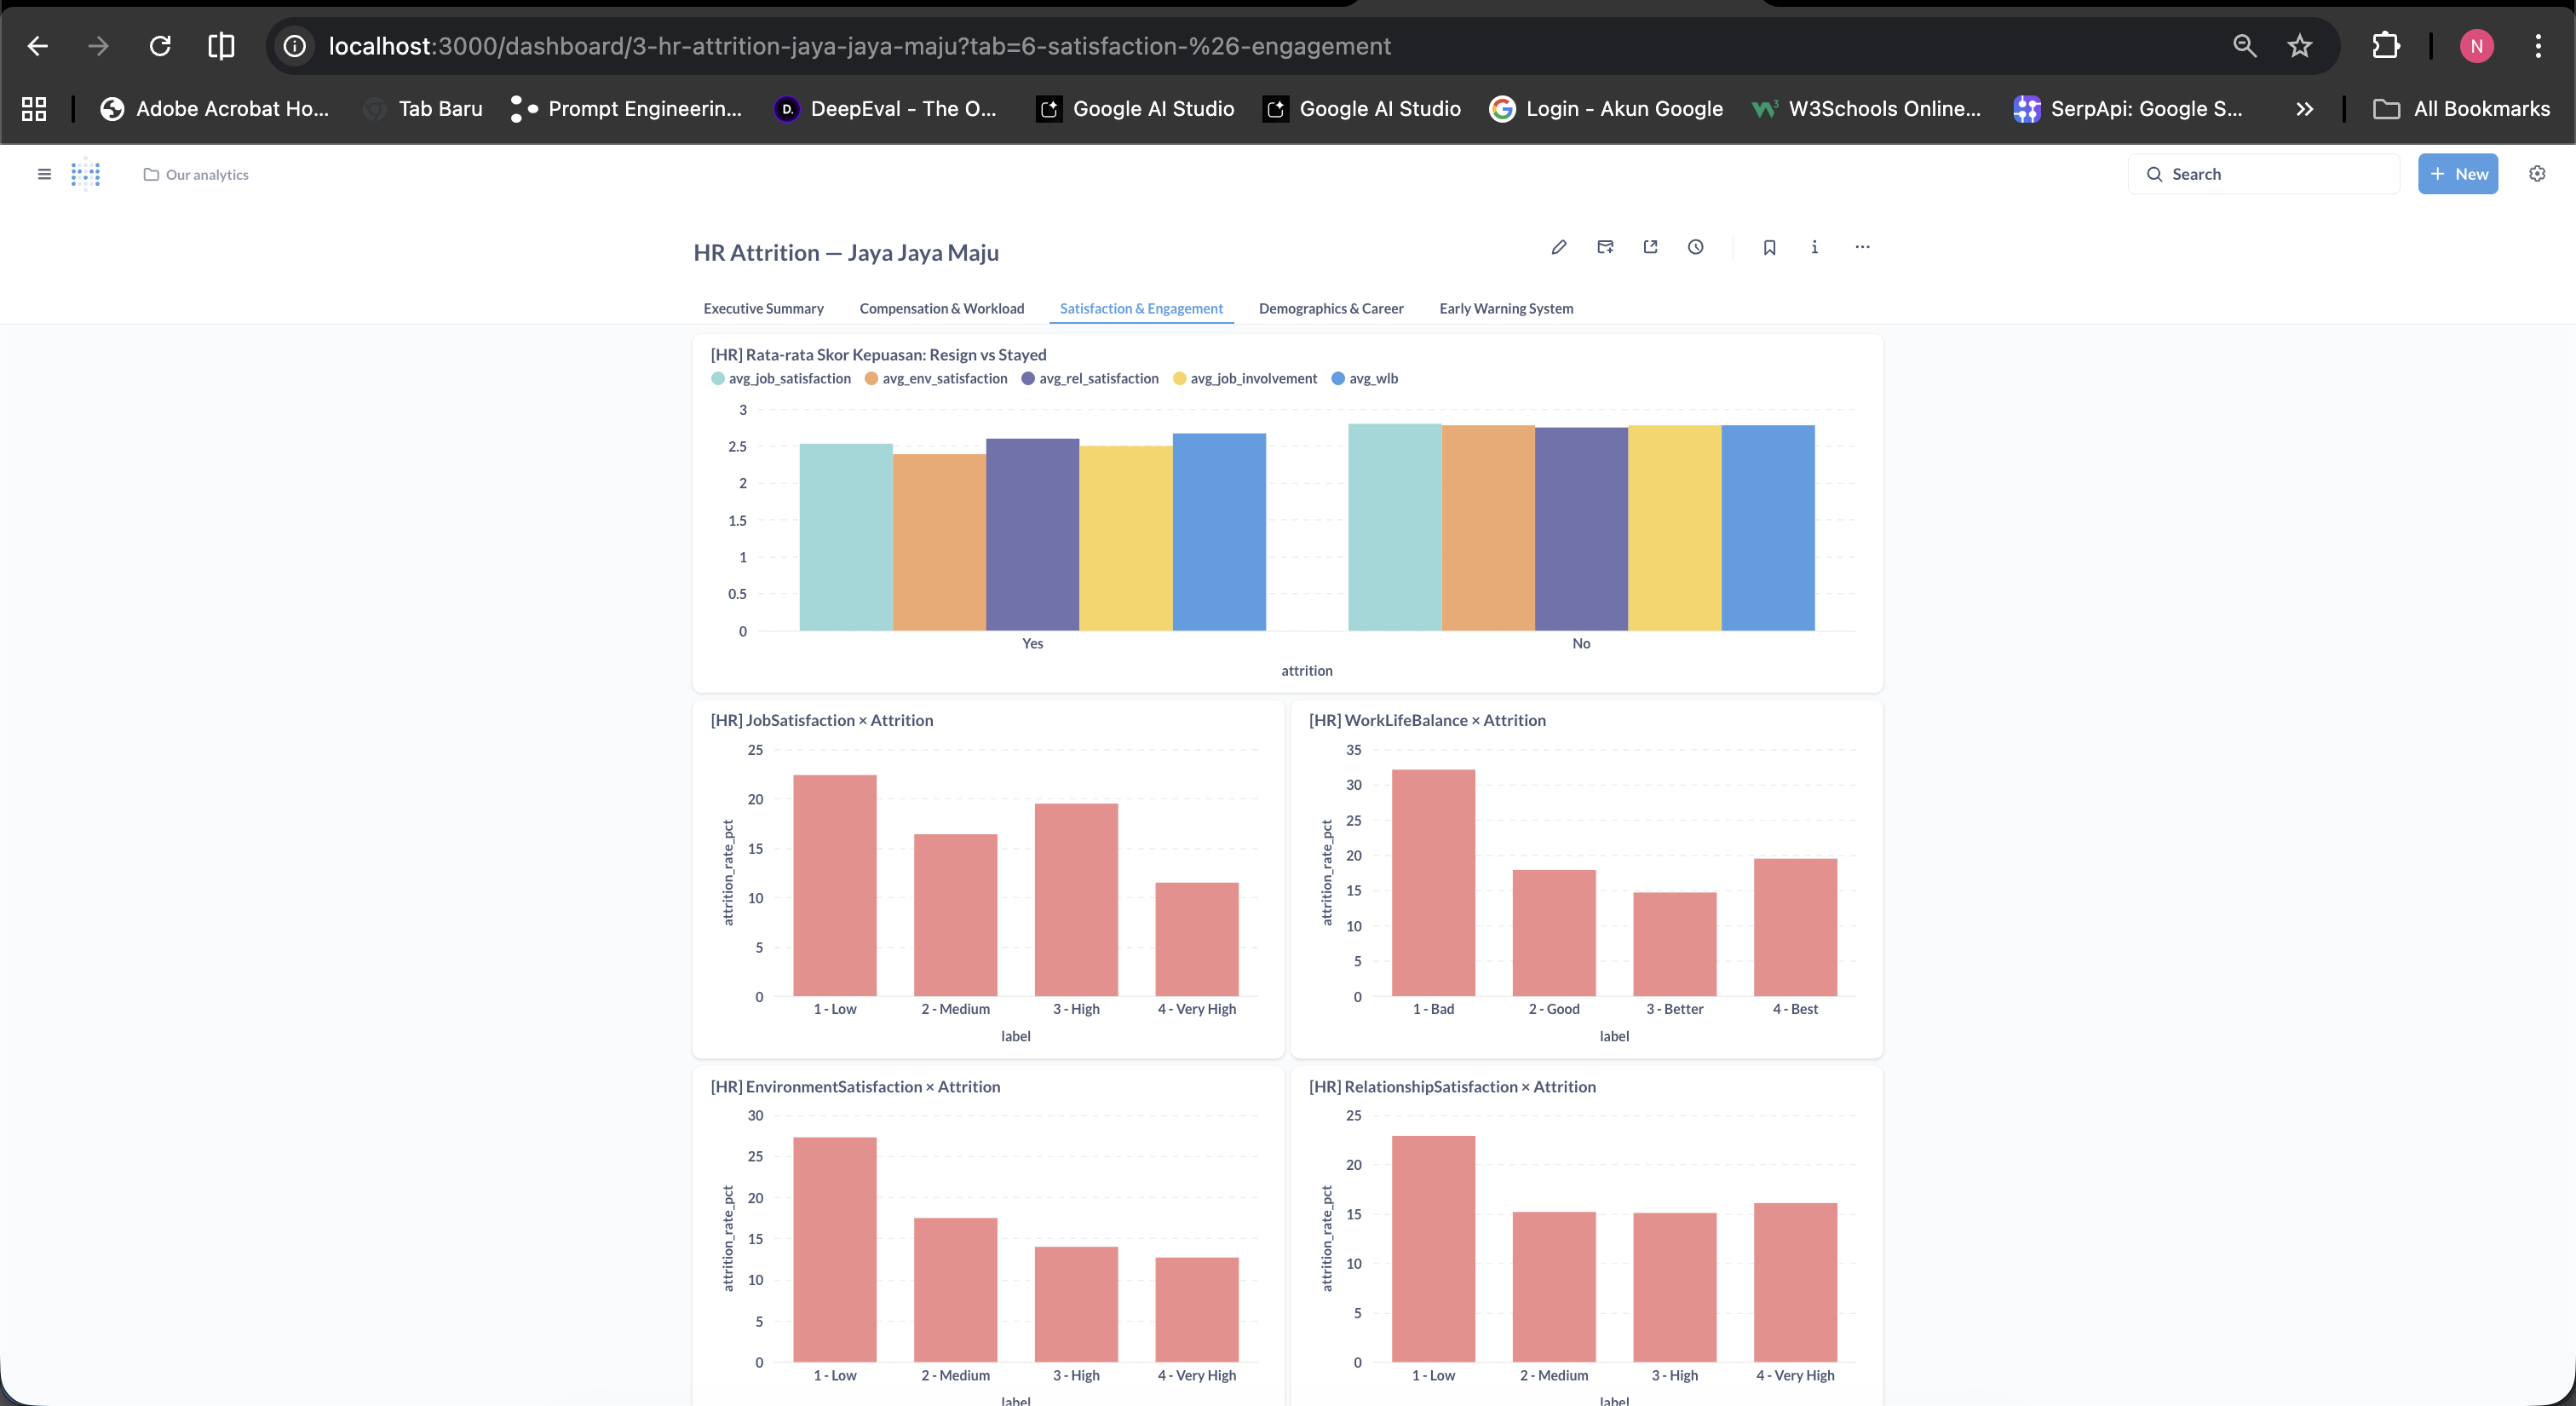
③ Satisfaction & Engagement Self-reported scores vs attrition
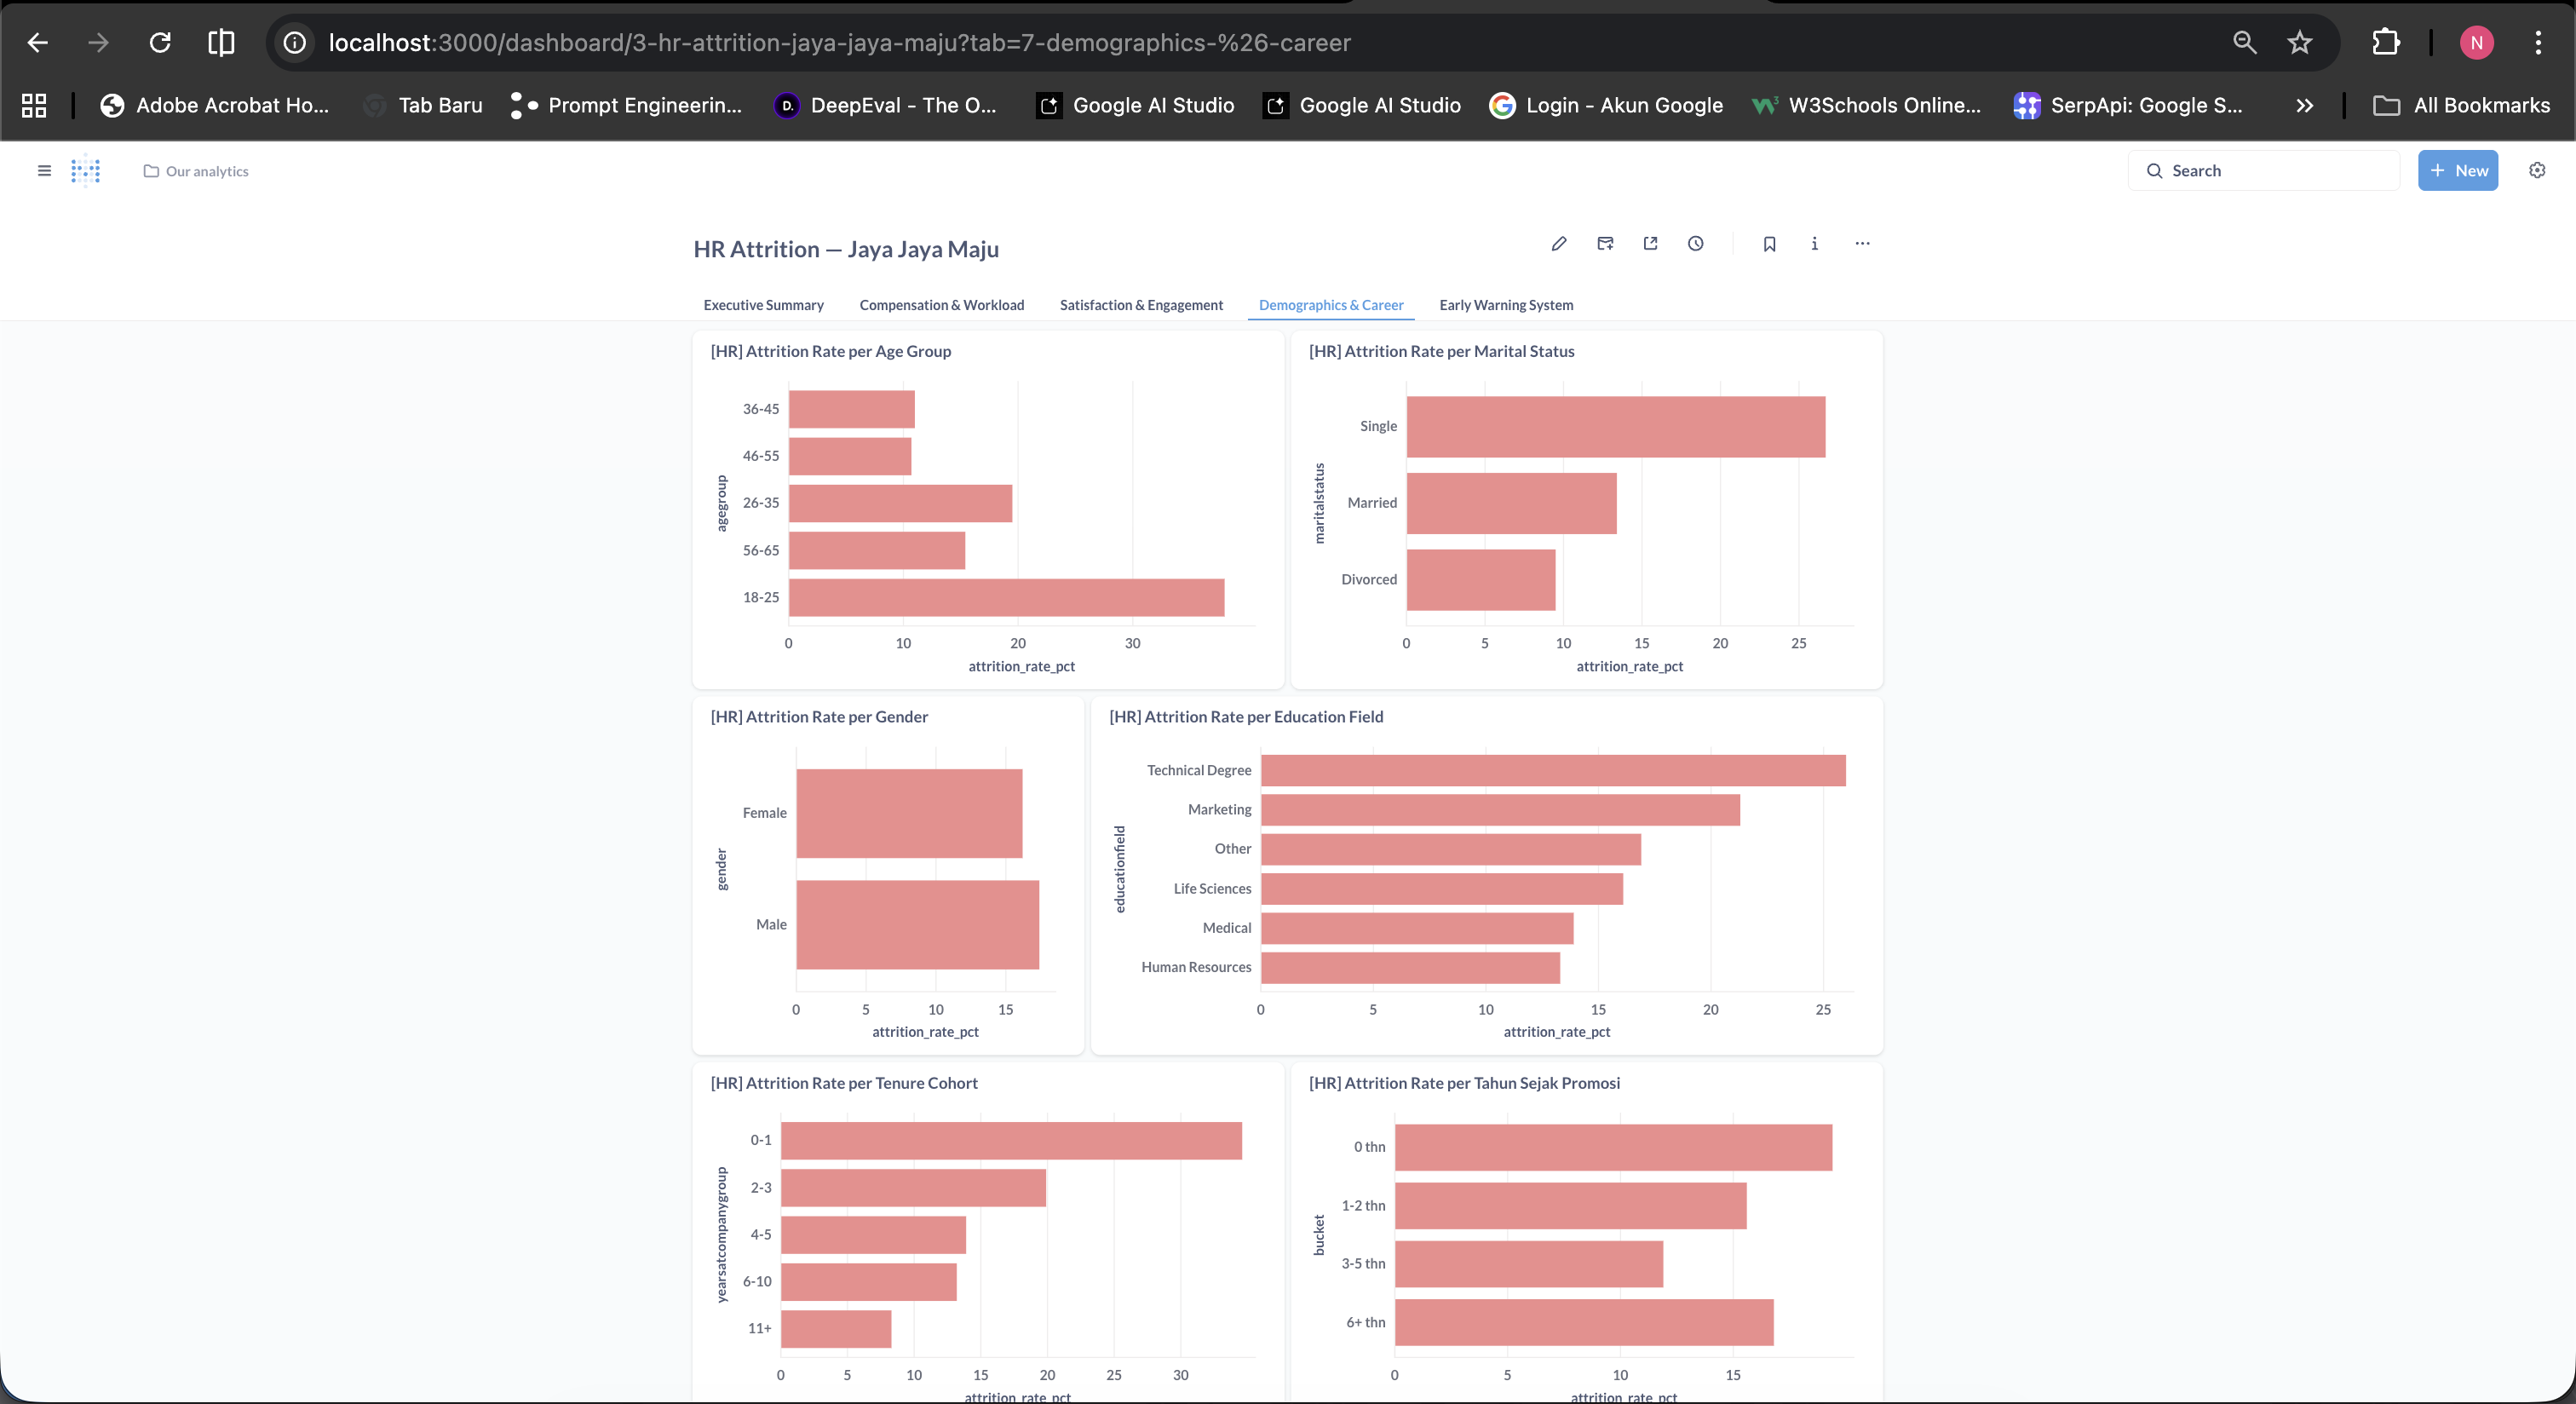
④ Demographics & Career Age groups · tenure bands · promotion recency
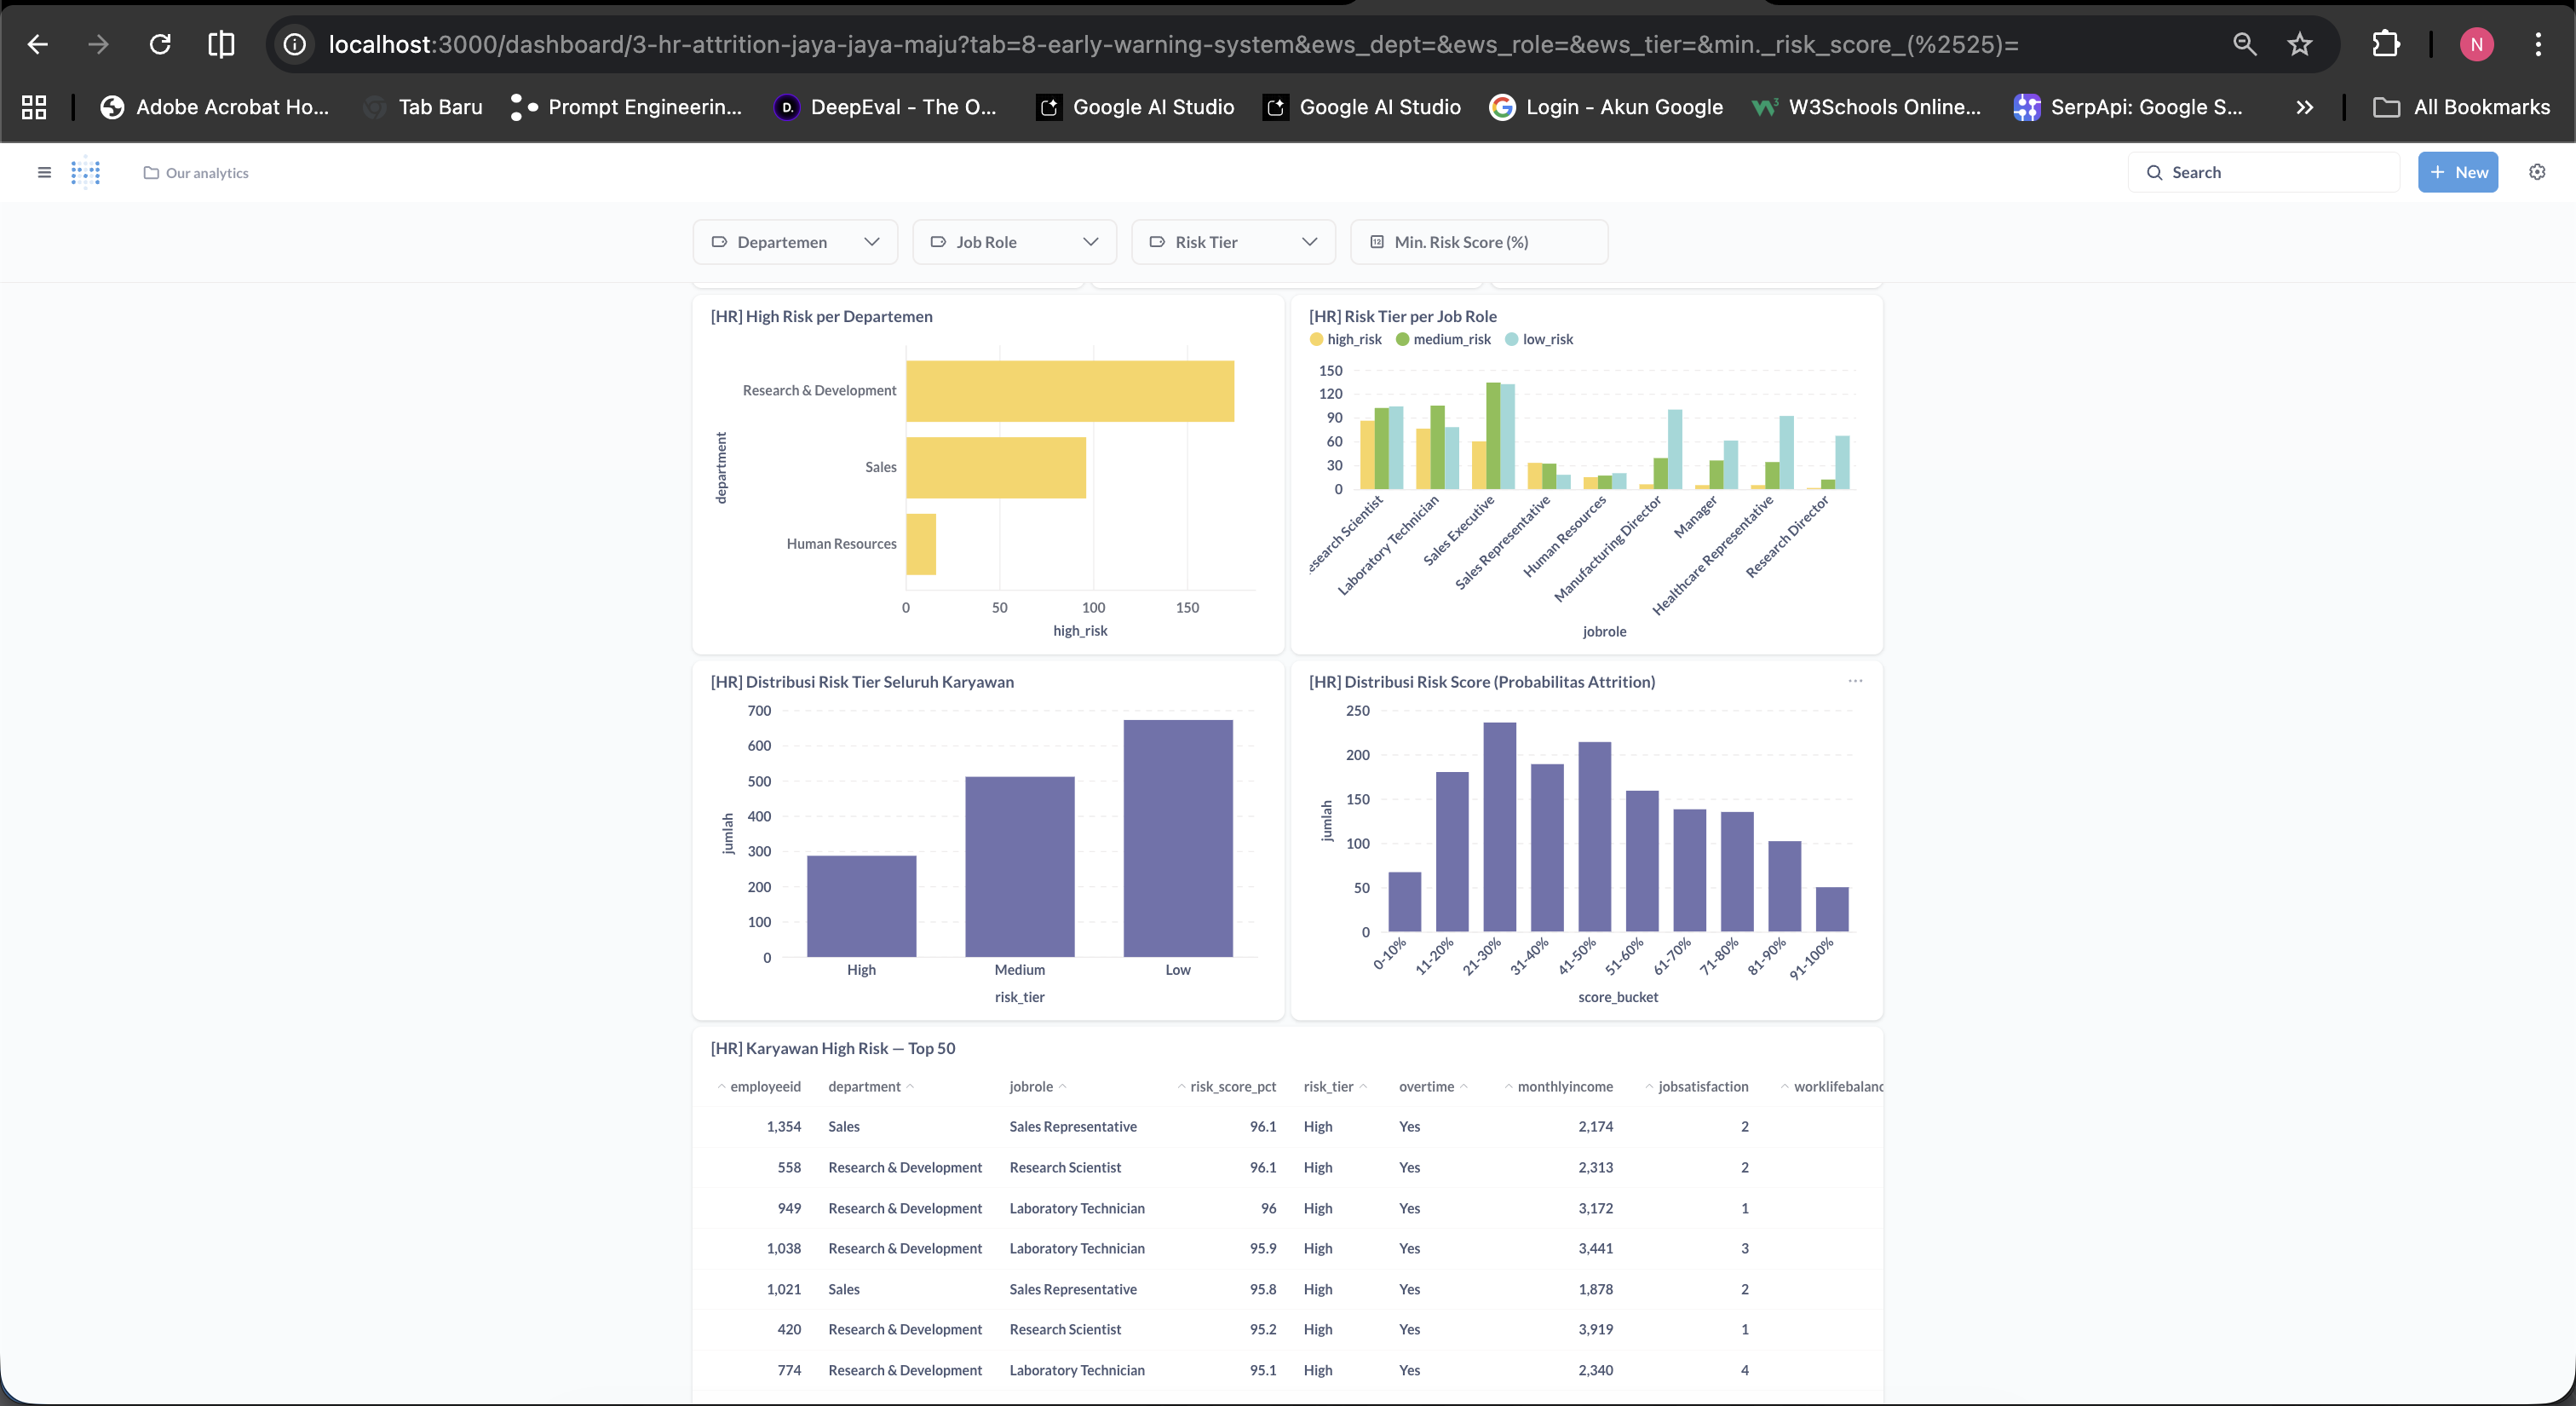
⑤ Early Warning System Risk tiers · top high-risk employees · department filter